MCX Crude Oil - How useful are fundamentals really ?
As on Wed 24 June 2026. CMP 6,900. Posted at 11:30 am. This is a Free Public Update.
Our updates of the past 2 months 23 April, and 24 May, both highlighted NOT taking a position.
Crude, then, was trading at a high-flying CMP of 9218 (24 May) and 8,700 (23 April), and the collective urge of the market was to predict a massive fundamental breakout amid geopolitical friction. Our stance, however, was stubbornly conservative: Wait. Watch. Let Crude reveal its hand.
Crude has dropped over 2,200 points (~24%). For anyone who chose disciplined patience over anticipation, that wait-and-watch approach didn't just save capital—it provided a masterclass in market structure.
However, let’s be entirely precise about where we stand today. The market has dropped its cards, but it has not yet fully revealed its final hand. We are sitting at a critical structural junction where both of our competing counts require absolute validation.
🟦 The Structural Breakdown: One Hanging by a Thread, One Awaiting Confirmation
The market structure has resolved into two beautifully clear, competing Elliott Wave charts. They are two sides of the exact same coin, and the battle is being fought over a single price zone.
1. The Bullish Count: Hanging by a Thread
The larger degree bullish impulse sequence is technically still alive, but it is breathing its last breaths.
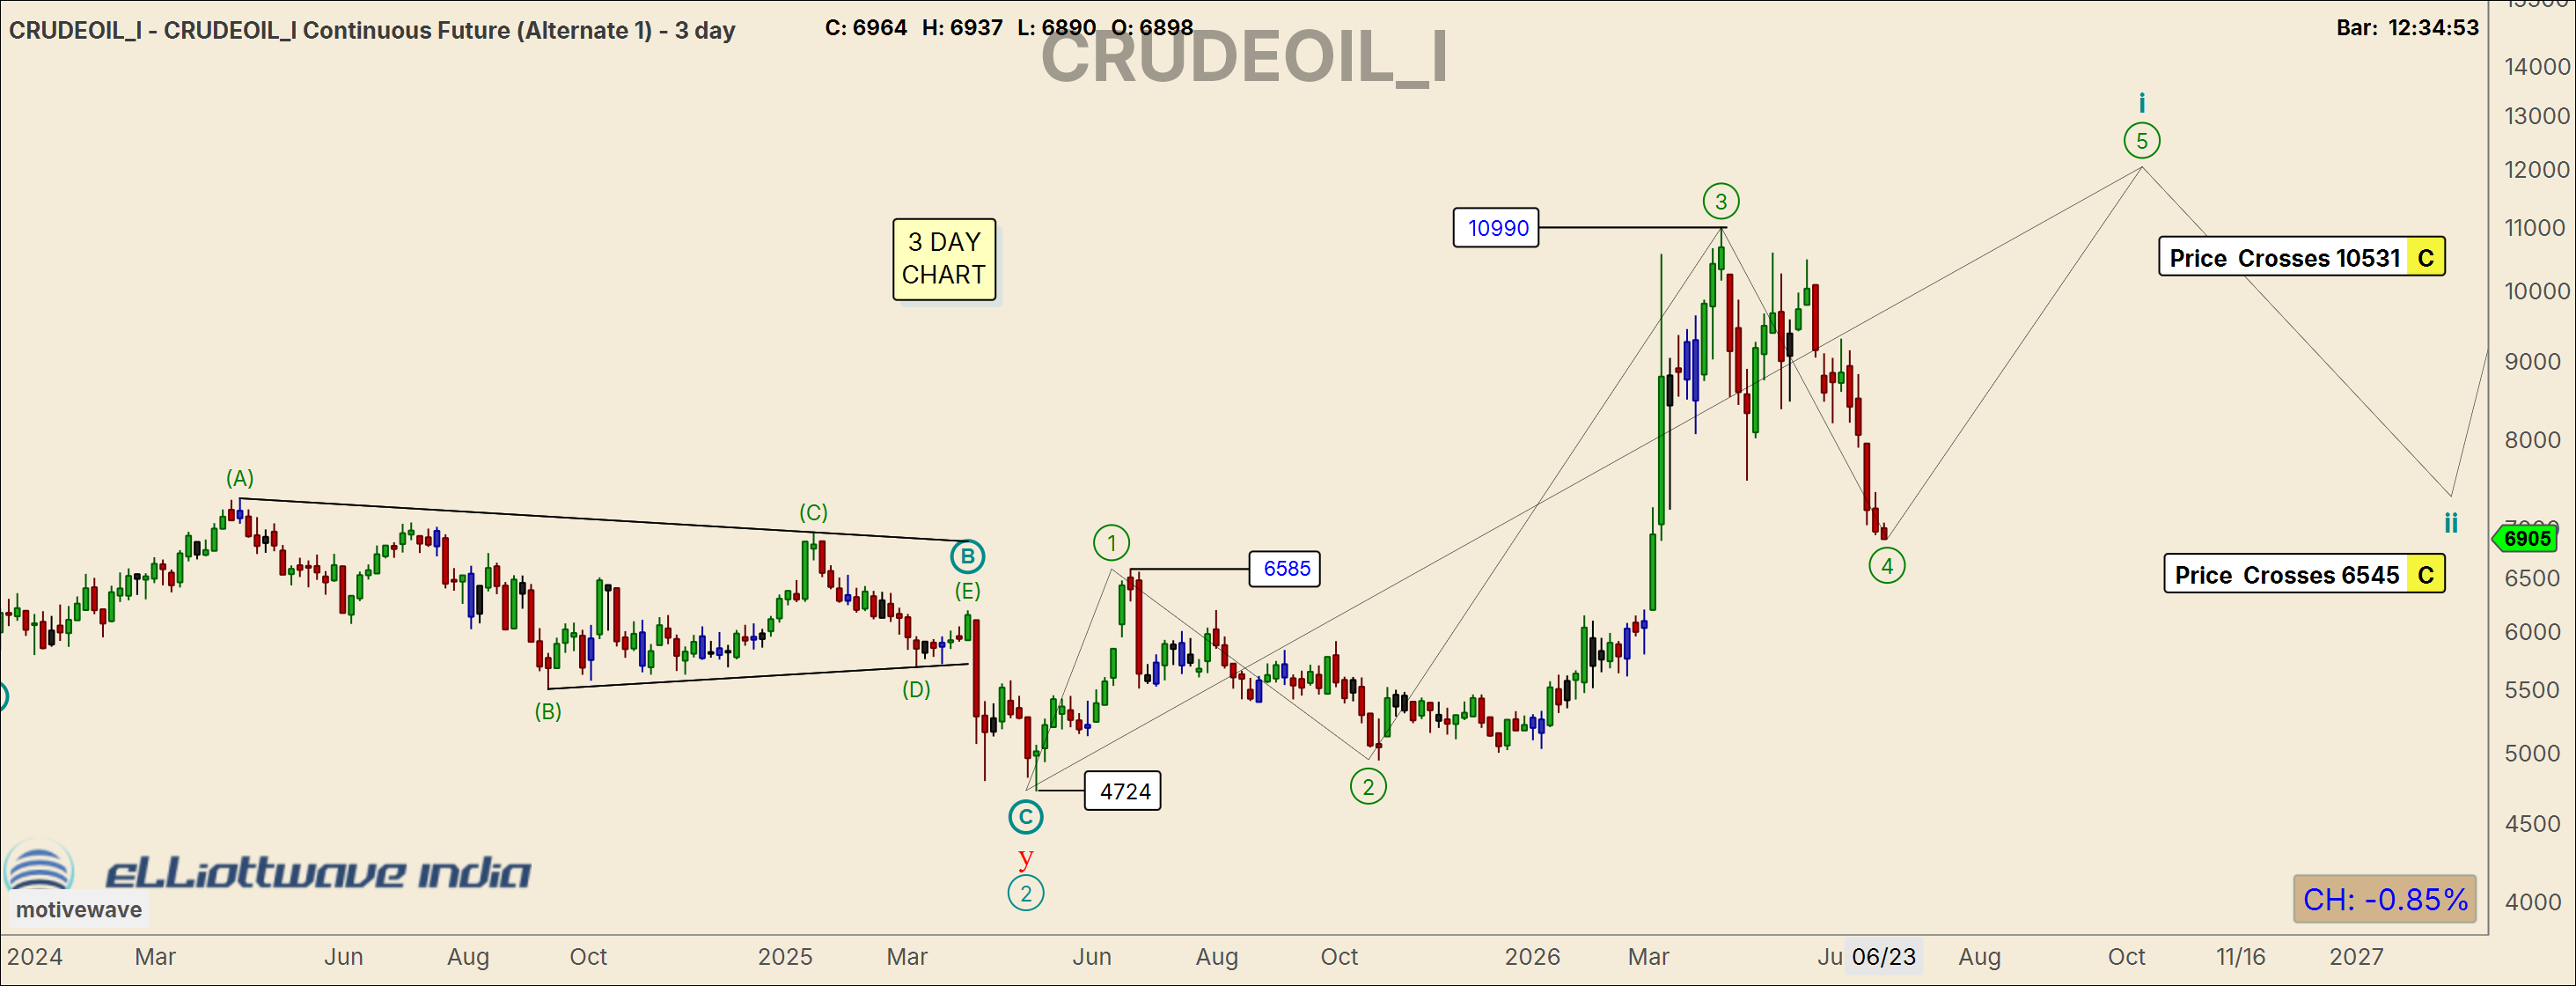
- In this sequence, the massive rally to 10990 is labeled as a Wave 3, and the current steep decline is treated as a highly aggressive Wave 4 correction.
- The Critical Invalidation: A core rule of Elliott Wave is that Wave 4 cannot overlap with the price territory of Wave 1 (which peaked at 6585).
- As shown on the chart, the system has set an absolute hard stop: "Price Crosses 6585". If Crude slices below this level, this entire bullish impulse framework is instantly dead. At a CMP of 6900, the bulls are officially backed into a corner.
2. The Bearish Count: Plausible, But Unconfirmed
Conversely, this alternate view is looking increasingly realistic given the sheer velocity of the recent downside.
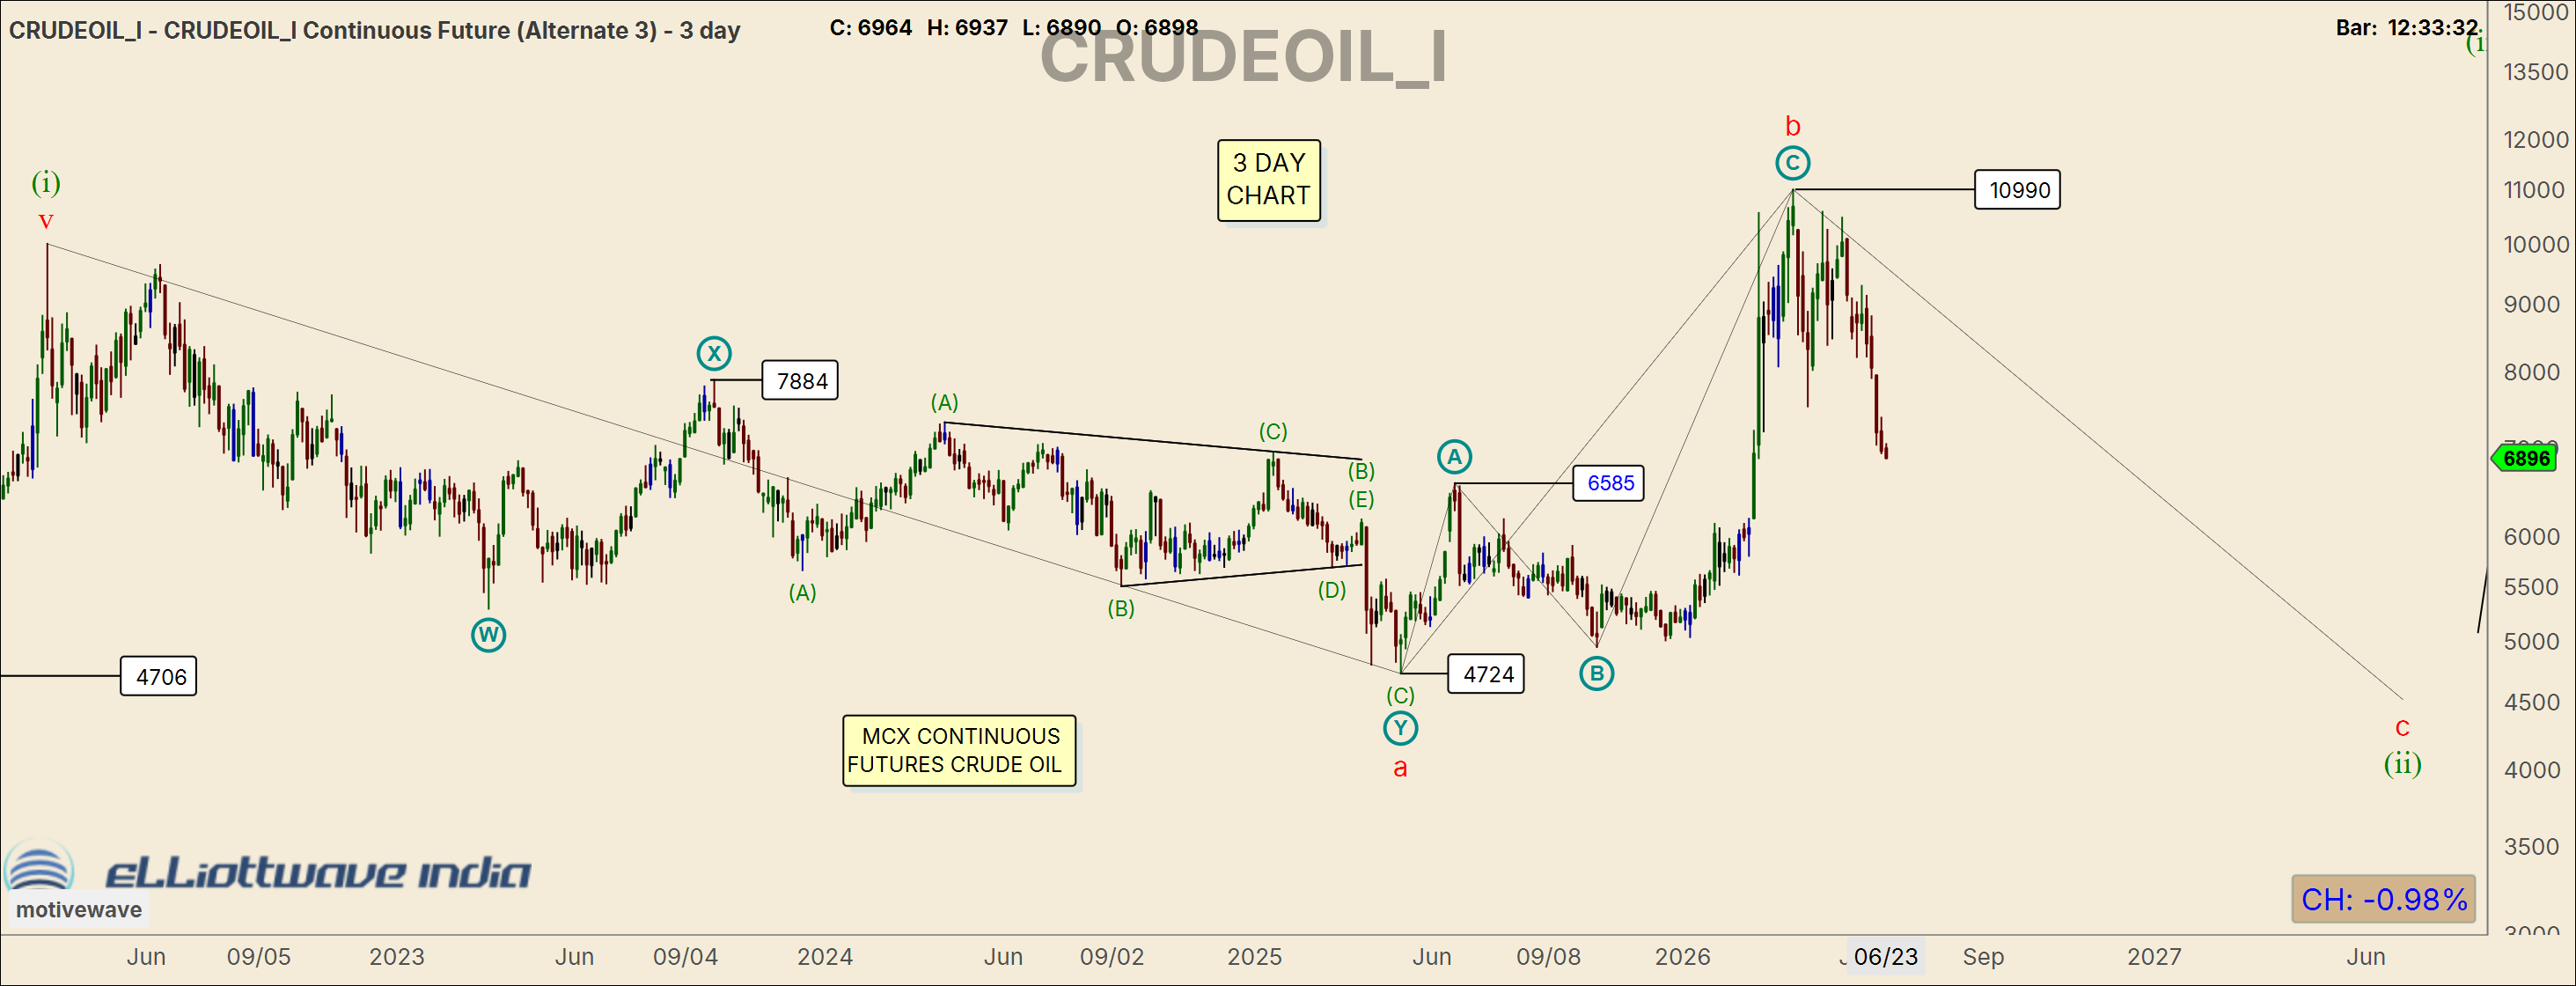
- This framework suggests that the entire rally from 4724 to 10990 was a corrective 3-wave structure (Wave b of a major Flat). If true, the current decline is a malicious, destructive Wave c that intends to drag Crude significantly lower, potentially towards 4,700.
- The Critical Validation: Just as 6585 serves as the execution floor for the bulls, it serves as the confirmation trigger for the bears. This count requires a touch of 6585 to mathematically invalidate the impulse count and confirm that a larger structural flat correction is actively playing out (this level if broken does NOT serve as a trigger for bearish trades).
🟦 Why Trading on Fundamentals is Inherently More Risky
This exact setup perfectly highlights why trading purely on fundamental narratives—while entirely possible—presents a vastly higher risk profile for traders:
- The Mirage of the Narrative: In May, the fundamental narrative was wrapped in geopolitical risk premiums and supply disruptions. It felt "safe" to be long because the news was bullish for Crude. Yet, the price collapsed anyway. Fundamentals frequently tell you what was happening, or what might happen, but they rarely tell you what the market has already priced in.
- No Fixed Point of Failure: If you buy Crude based on "Middle East tensions," where is your stop-loss? At what exact price point does the geopolitical tension become "invalid"? It’s impossible to quantify. Fundamental traders often end up averaging down into a massive losing position because "the narrative hasn't changed," even as their account balance vanishes.
🟦 Technicals & Elliott Wave: Finding Where You are Wrong Before You Enter
The true superpower of technical analysis, specifically a disciplined application of Elliott Wave, is not its ability to predict the exact future. Its true edge lies in its capacity to provide absolute values for where a trade setup is wrong.
By looking at these two charts, we don't have to guess, hope, or argue with the market. The structure gives us objective, unyielding price boundaries:
- We know to the exact rupee where the bullish impulse dies (6585).
- We know to the exact rupee where the bearish flat is validated (6585).
Because these two levels have not been breached yet, the market remains in a structural no-man's-land. Entering a trade right here is simply gambling on anticipation.
🟦 The Tactical Mandate
We don't need to be early to make money; the wave counts need to be validated. Until validation, they remain educated hypotheses.
We will let the market fight its battle around the 6585 zone. If the market holds above it and prints a definitive bottoming structure, we can risk a bullish trade with a tight, clearly defined invalidation level. If it slices through, the alternate count takes the steering wheel, and we prepare to trade a structural leg down.
🟦 No validation = No trade. Let Crude break the thread or confirm the flat before committing a single rupee of capital.