MCX Crude Oil
🟦 Note: This report has been moved to the Free Section as a sample of the analytical process used at Elliott Wave India.
Please note that market structure evolves over time, and wave counts can change as fresh price data emerges.
The objective is not simply to forecast price — but to understand where we are within the trend, and how that changes over time.
The analysis below reflects the view and wave counts at the time of publication, and may differ materially from current view and wave counts
If this level of work saves you from even one avoidable mistake, the subscription may pay for itself.
Subscribers receive:
• Updated wave counts as structure evolves
• Alternate scenarios and invalidation levels
• Ongoing refinement as markets reveal more information
Start 14-Day Evaluation Access →
The analysis below reflects the view and wave counts at the time of publication, and may differ materially from current view and wave counts
As on Thursday, 23 April 2026 | CMP: 8,709 | Posted at 9:00 AM
Bottom Line
➡️ Structure is at a decision point
➡️ Bullish continuation requires acceptance above 10,990
➡️ Below 6,585, the entire rise risks being corrective
➡️ Best approach: Wait for clarity, not anticipation
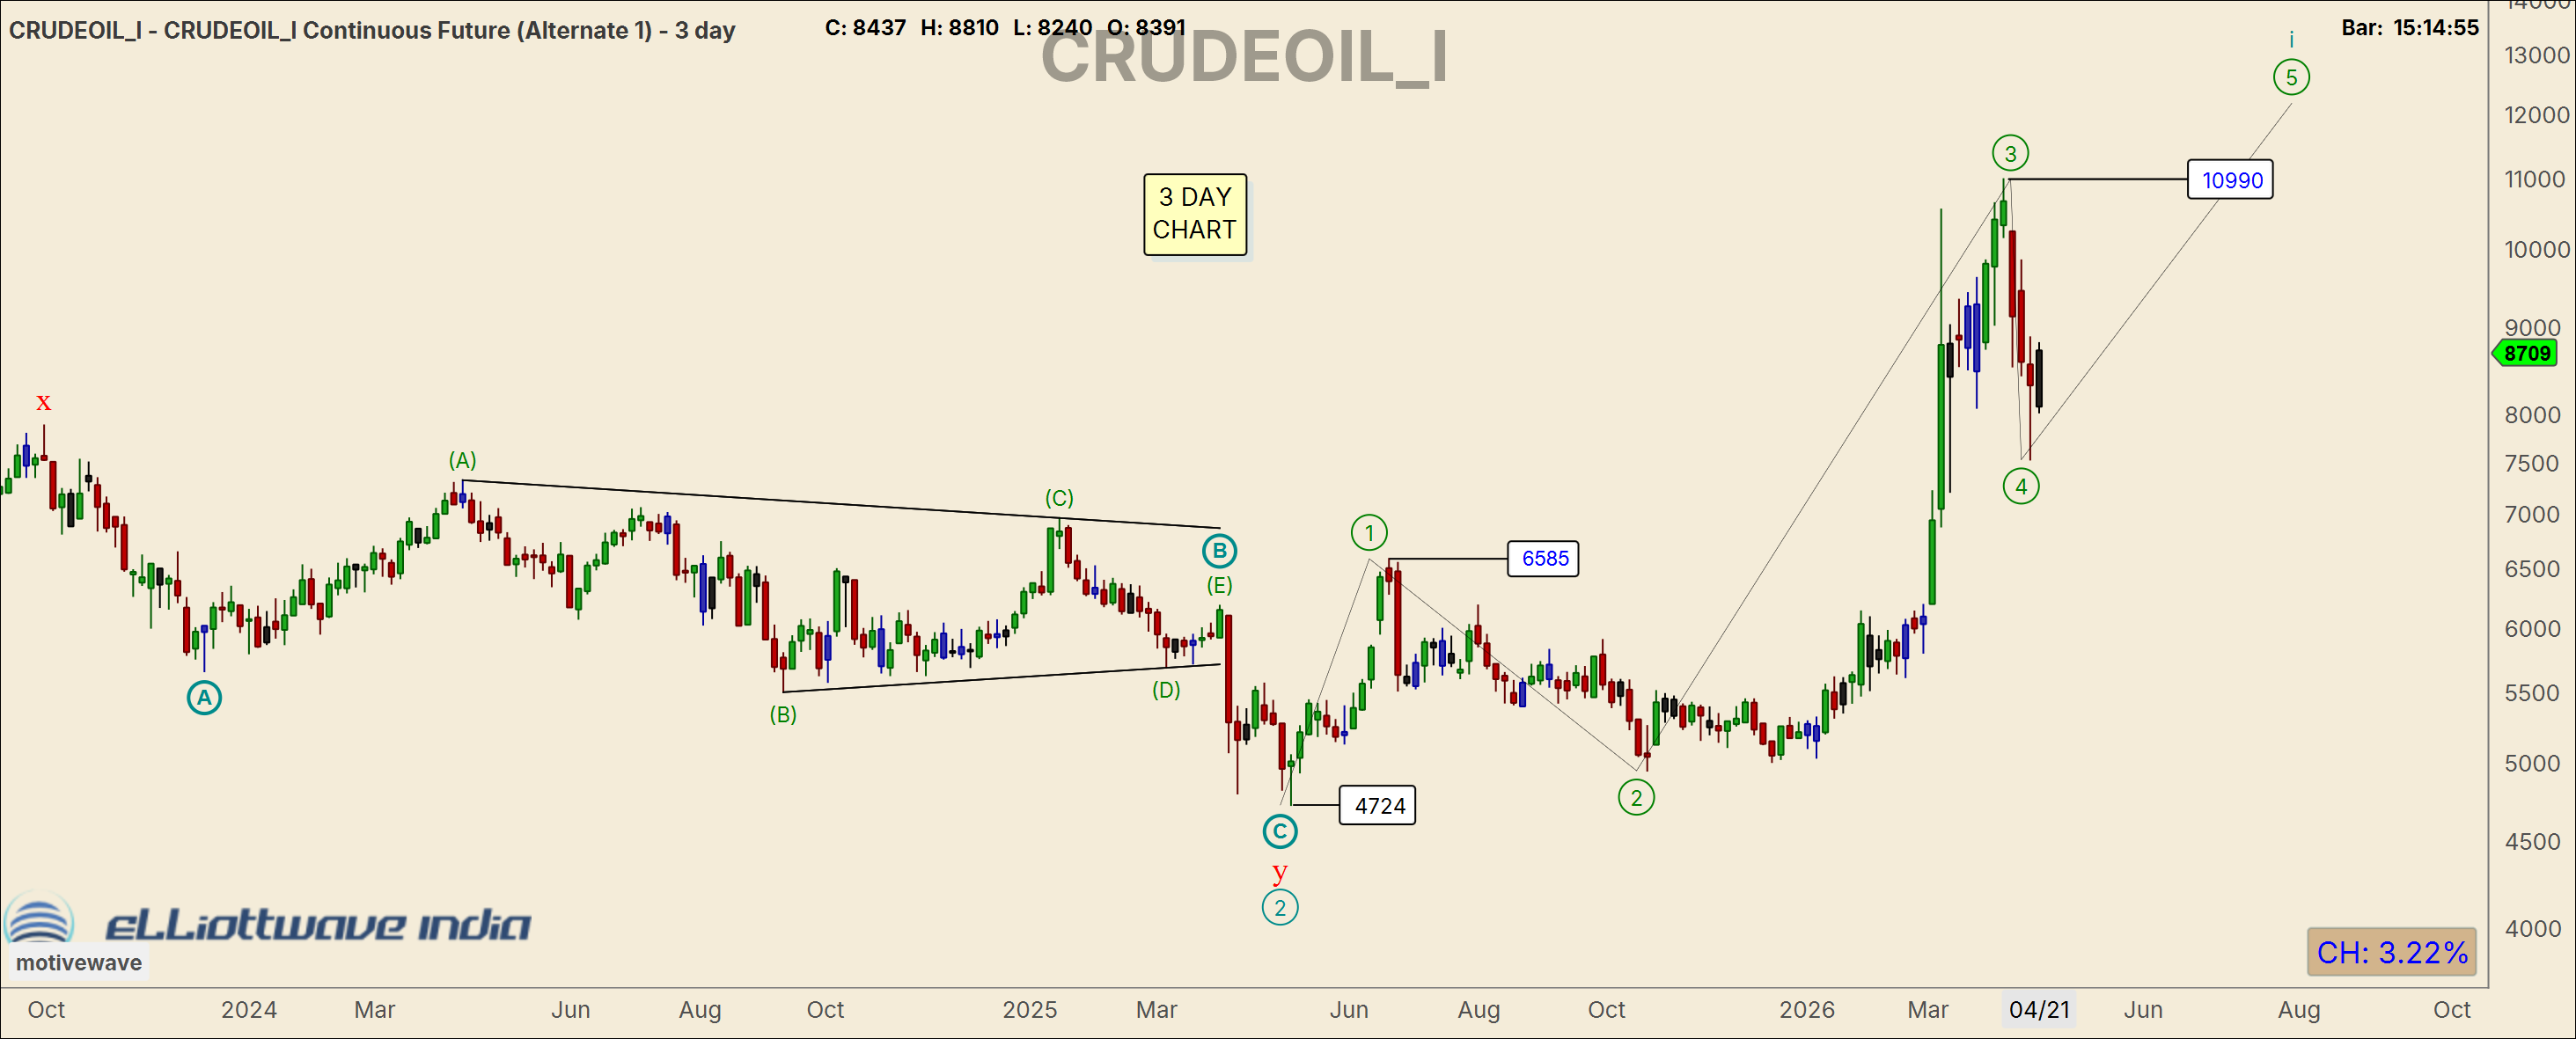
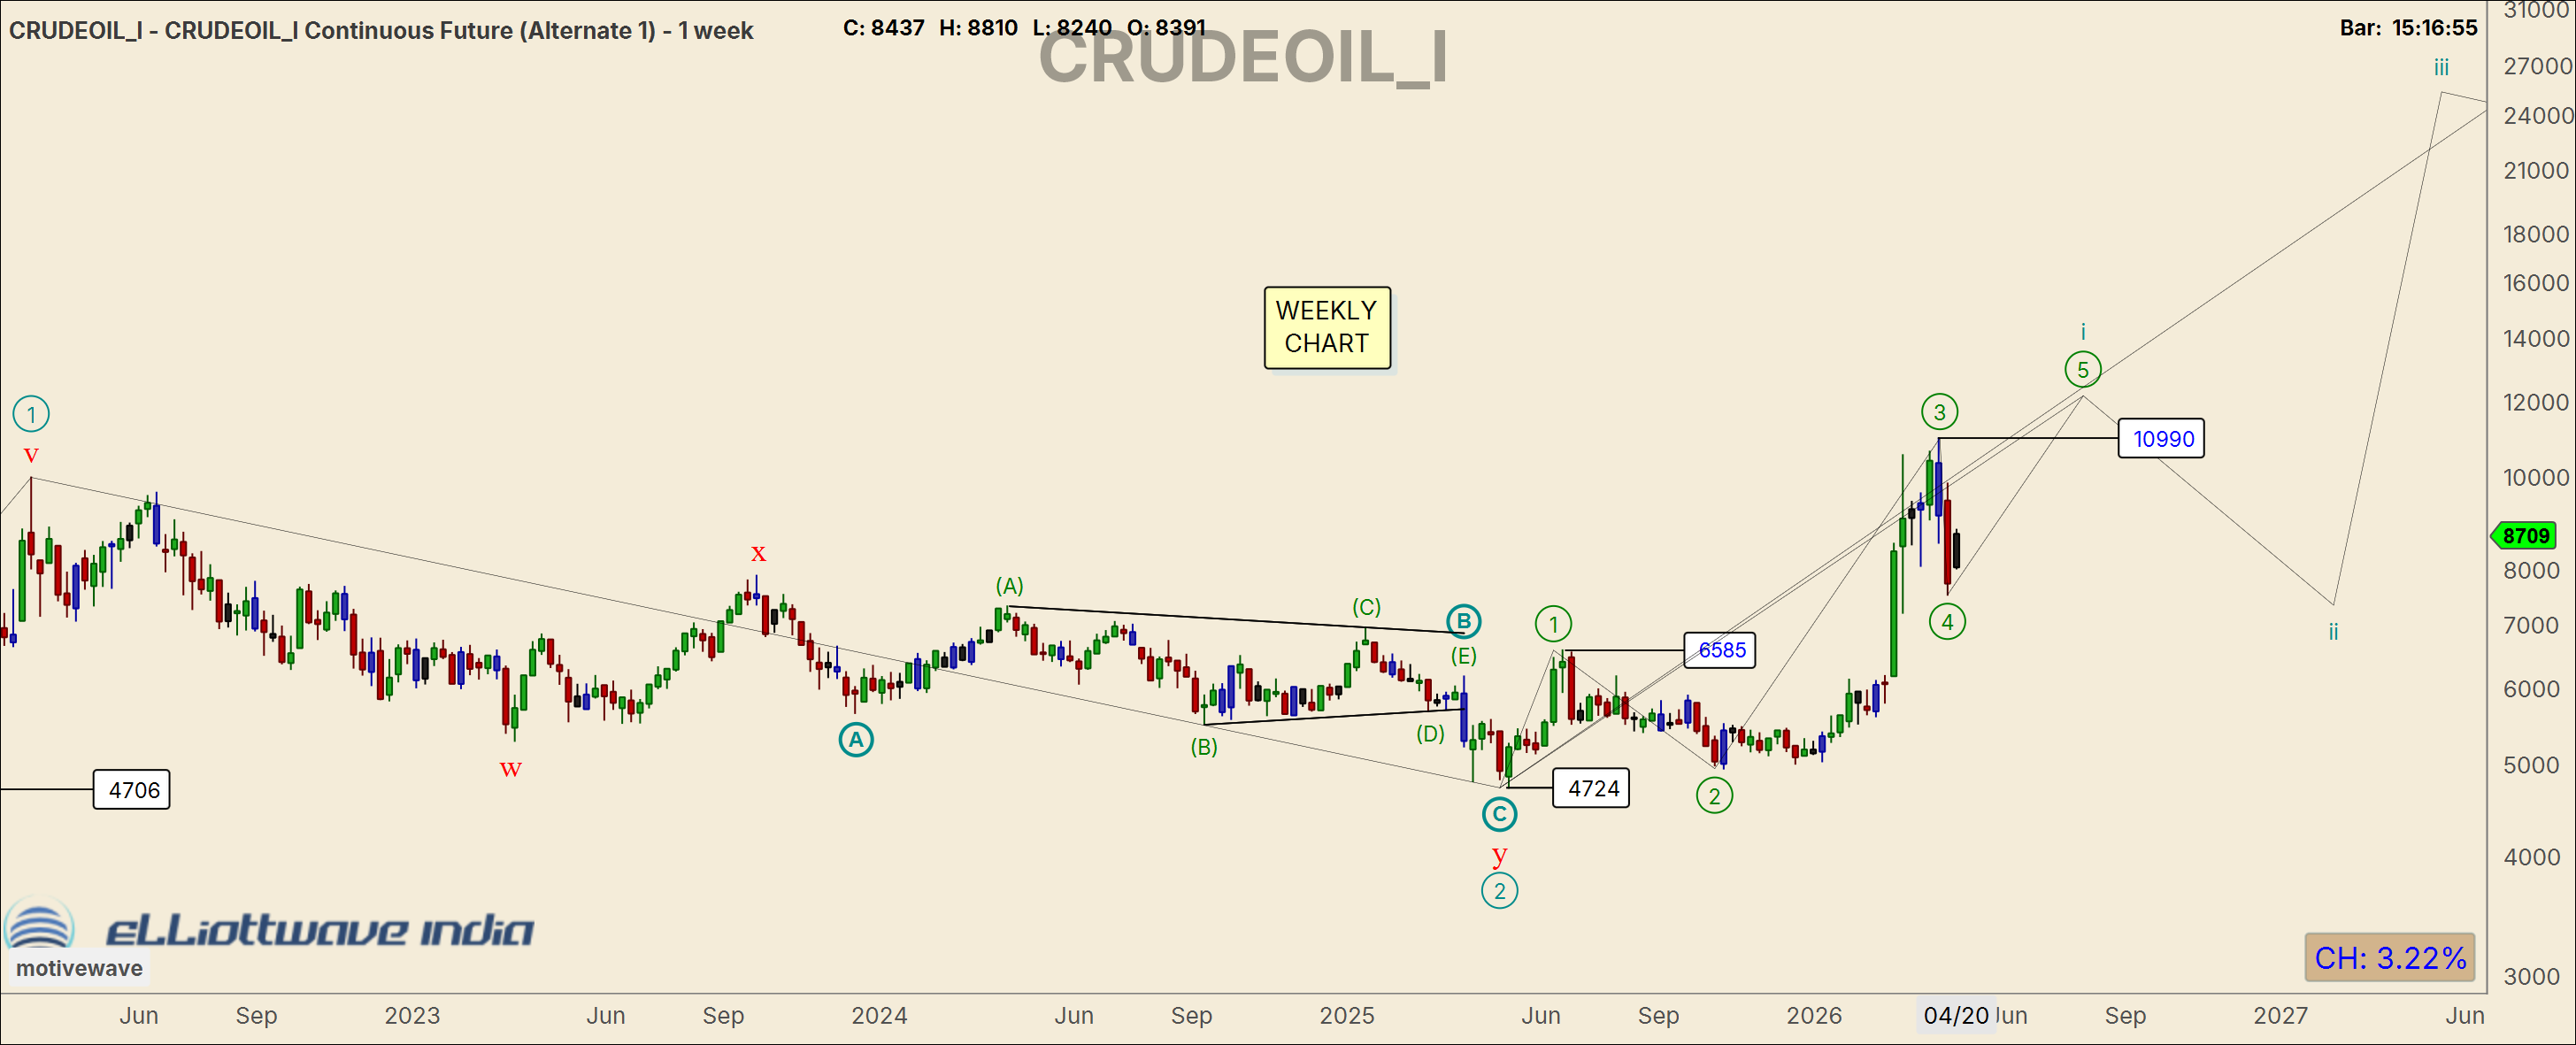
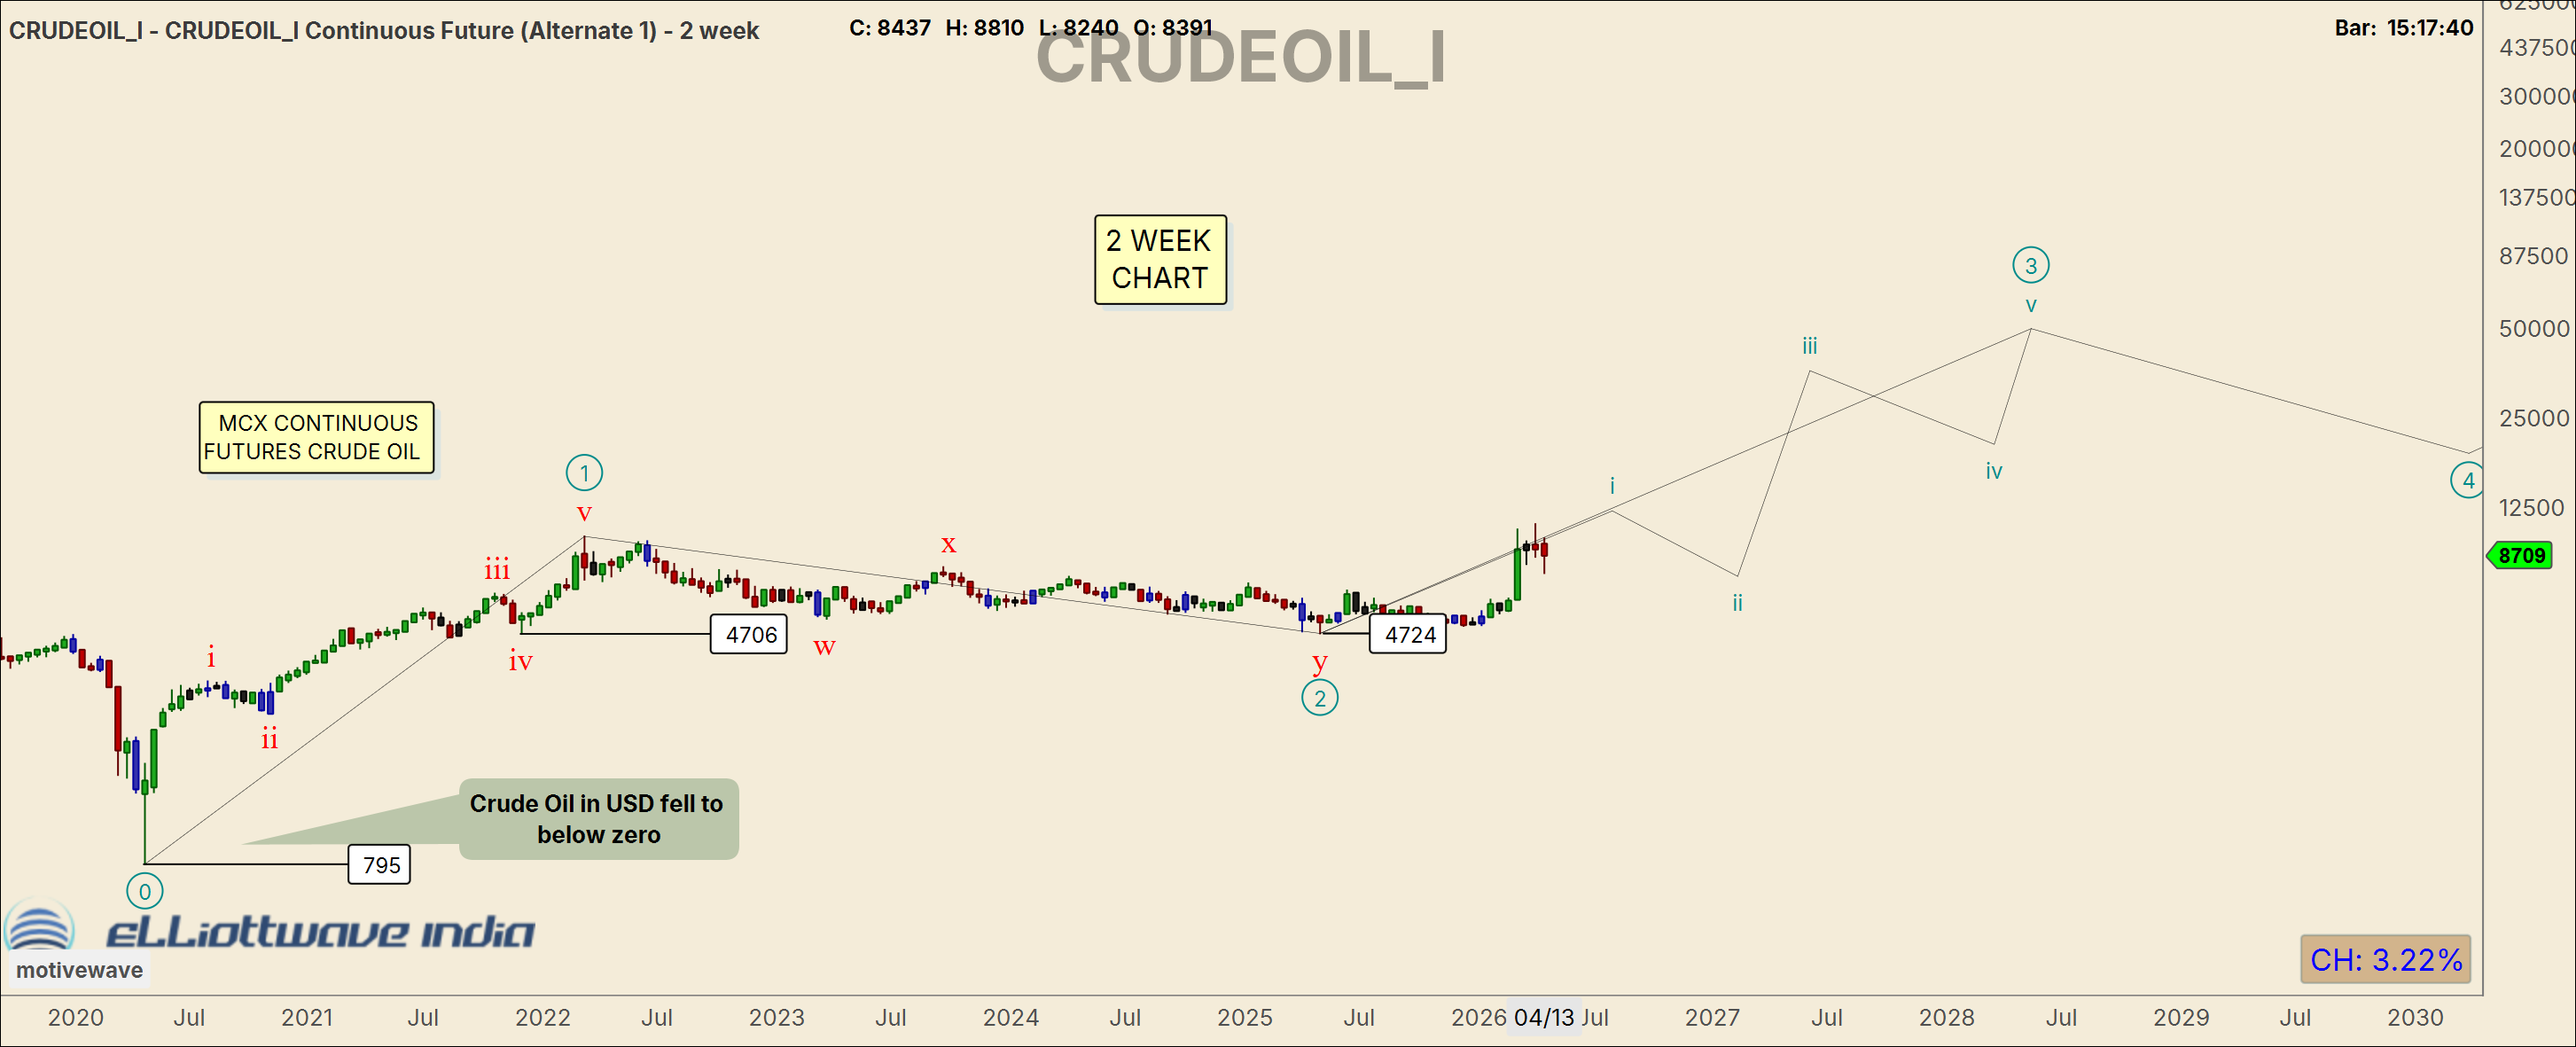
Primary Elliott Wave View
(3-Day / Weekly / 2-Week aligned)
The move from 4,724 → 10,990 is being treated as part of a developing impulsive structure, but confirmation is still pending.
- The rejection from ~10,990 suggests wave 3 may be complete
- Current phase likely represents wave 4 (time / price correction)
For the bullish structure to remain valid:
- 6,585 must hold
- Price must eventually break and sustain above 10,990
Only then does the structure transition from potential → confirmed impulse (wave 5)
--
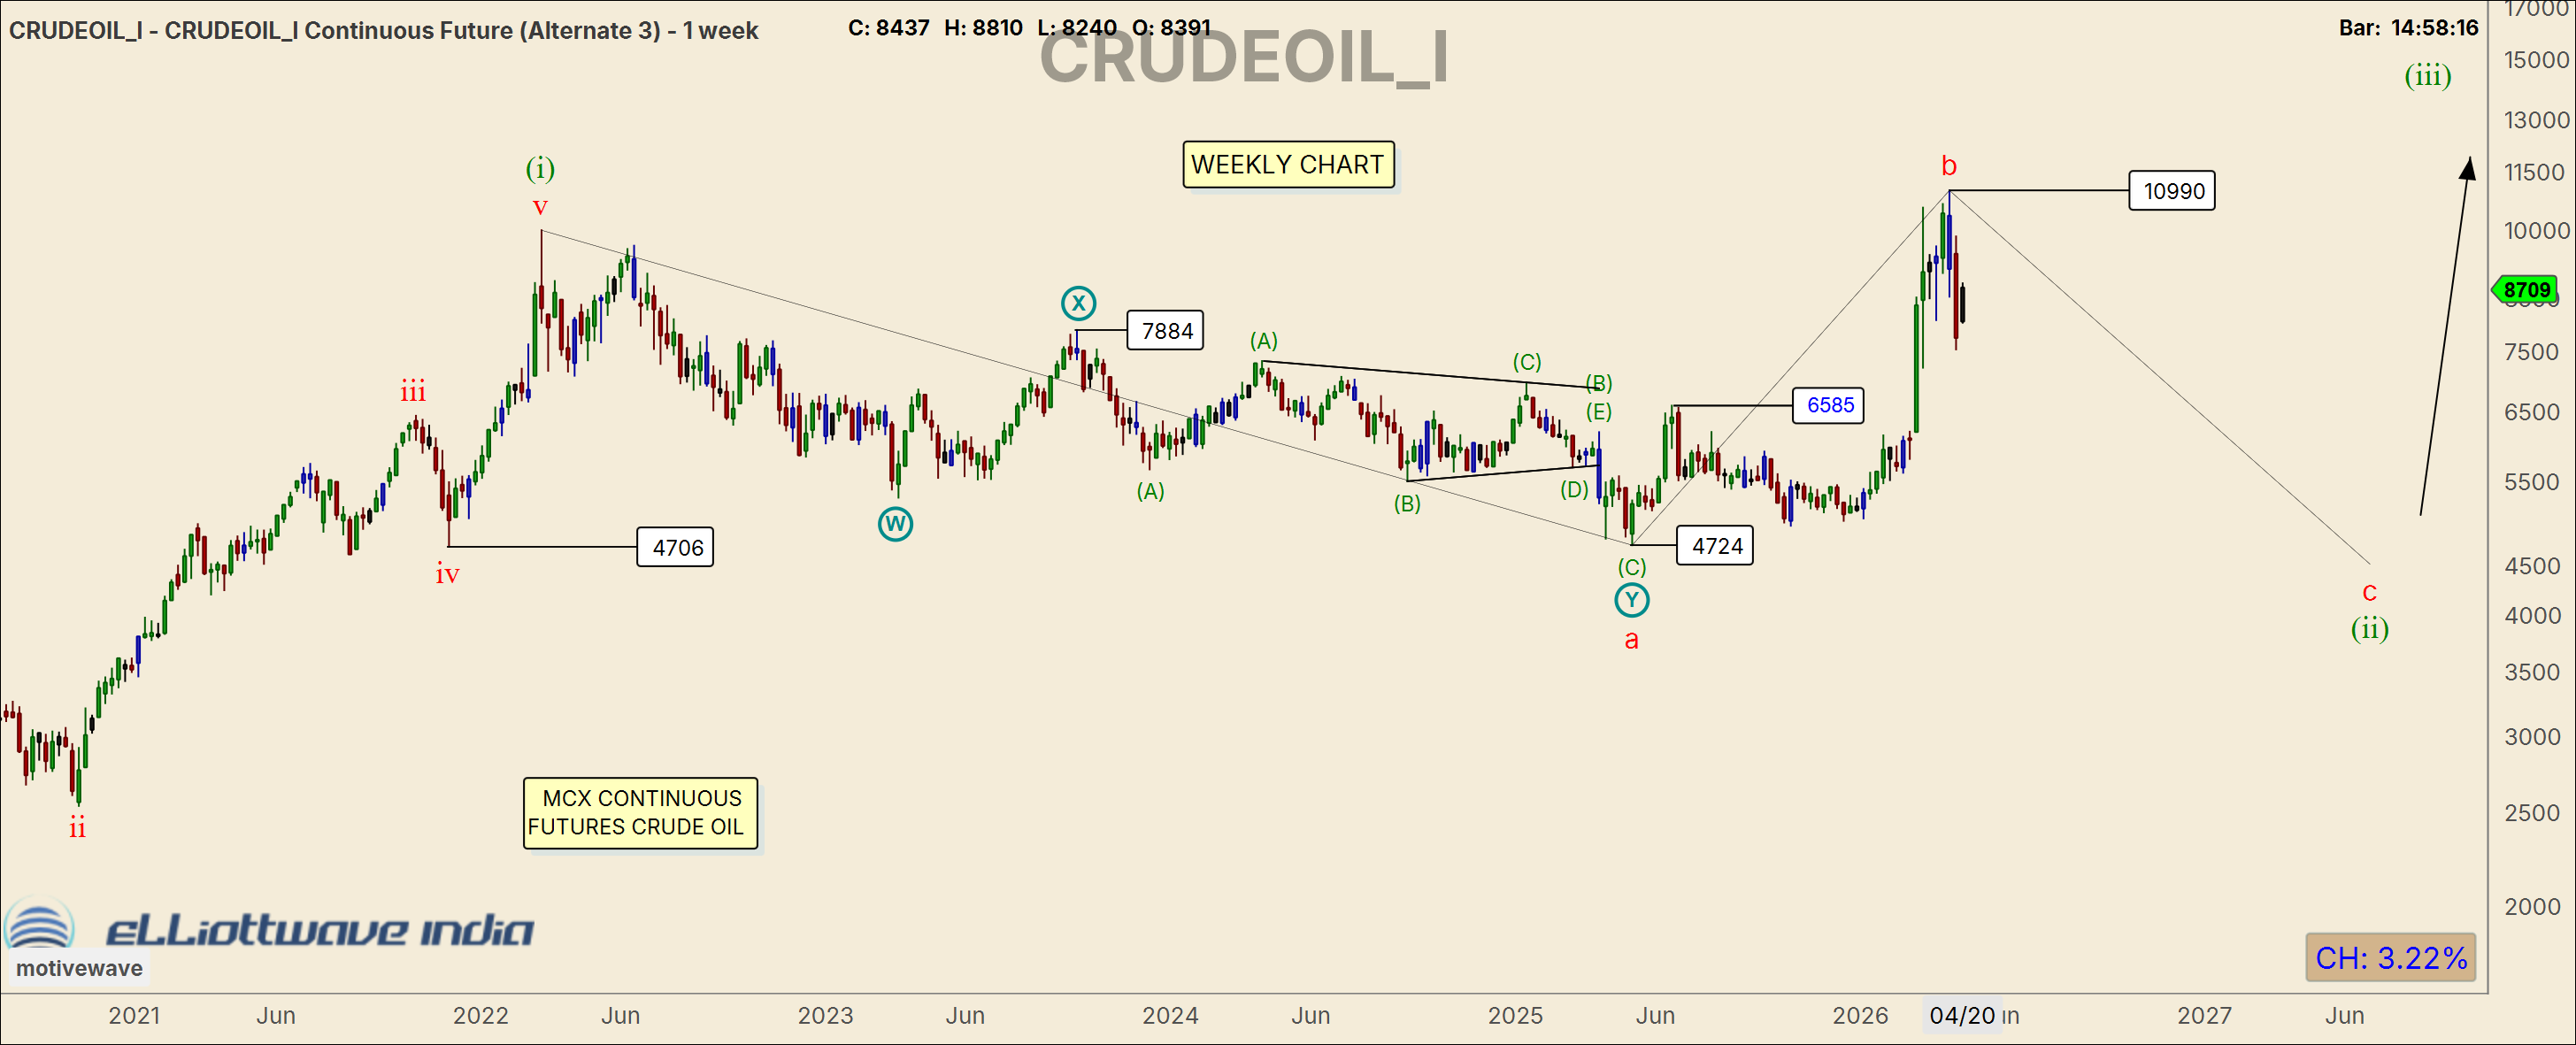
Alternate Count (Needs Equal Respect)
If 6,585 is breached first:
- The rise from 4,724 → 10,990 likely becomes a 3-wave corrective move
- This would imply the rally is wave B, not the start of a larger uptrend
➡️ Opens up wave C downside
➡️ Potential move back towards 4,724
➡️ Structure aligns with an expanded flat correction
What This Means Practically
- Above 10,990 → strength is confirmed, but not a chase
- The opportunity, if it develops, is after a pullback
- Between 10,990 and 6,585 → structurally unclear zone
- Below 6,585 → bearish structure takes control
Key Thought
This is a “prove it first” market, not a “predict and position” setup.
You are not being paid to be early here.