MCX Crude - Wait & Watch Approach Justified. Now what ?
MCX Crude Oil – Wait & Watch Approach Justified
As on Sun 24 May 2026. CMP 9218
A month ago (23 April update), the view was deliberately cautious:
🟦 Best approach: Wait for clarity, not anticipation
🟦 This is a "prove it first" market, not a "predict and position" setup
🟦 You are not being paid to be early
Over the past month, Crude Oil has delivered exactly the type of environment we wanted to avoid — high volatility, conflicting signals and headline-driven swings both in India and globally.
So far, patience has been rewarded. Now what ?
Bottom Line
🟦 The call remains unchanged : There is still no structural clarity.
At present, 2 competing Elliott Wave hypotheses remain valid, and price must confirm which path is unfolding before capital is committed.
Both counts are shown below.
Primary Count (Preferred) : Bullish Triangle
The preferred interpretation remains a bullish triangle.
If correct, Crude would likely spend more time moving sideways to lower first, frustrating both bulls and bears, before eventually breaking higher in a final thrust to complete a larger degree advance.
Daily Chart
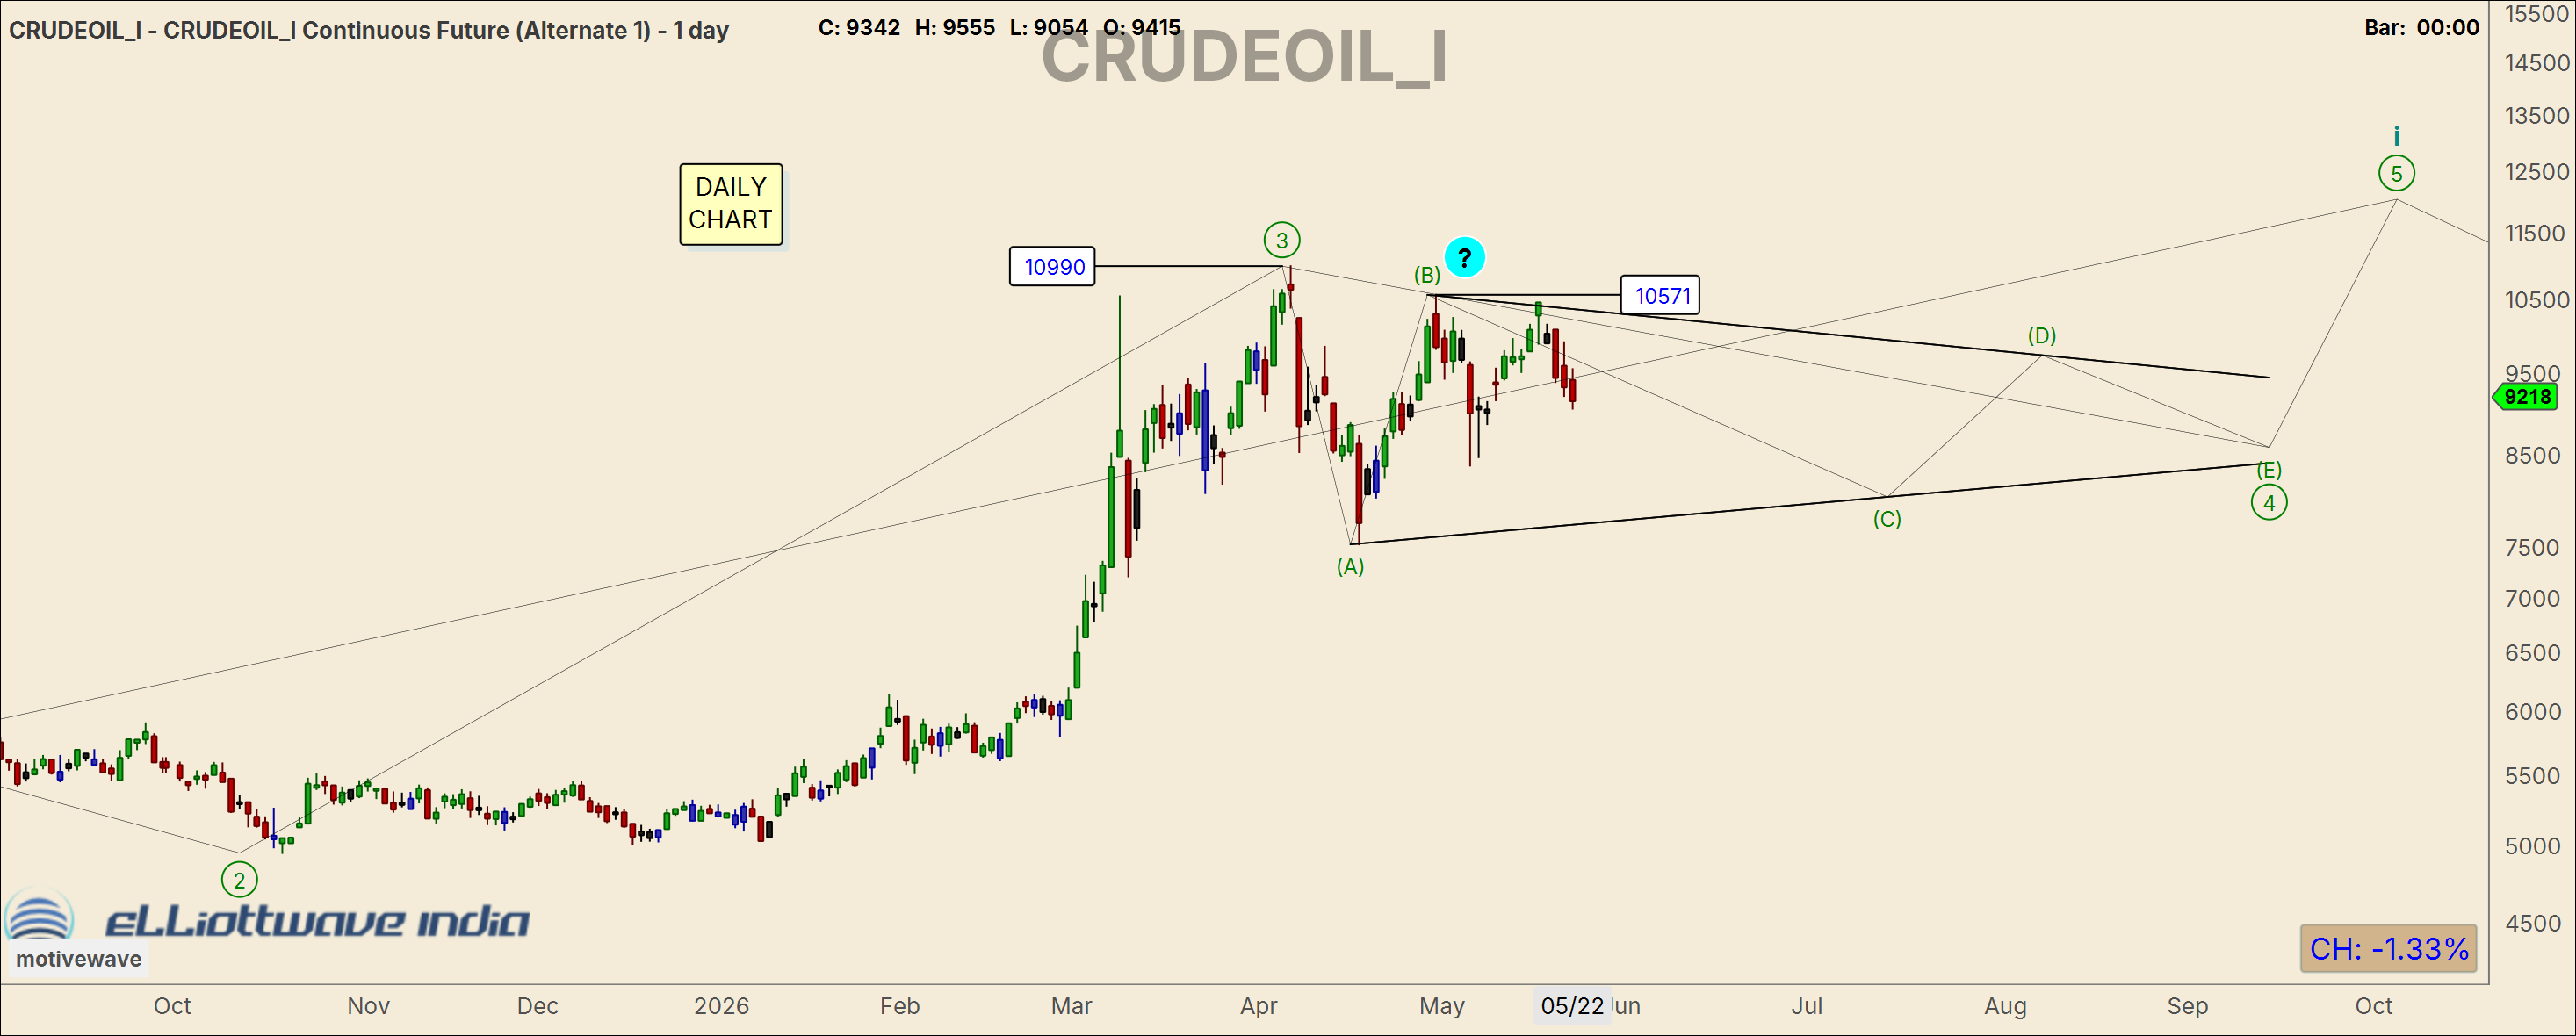
Potential bullish triangle in play.
This remains a market designed to create frustration — premature longs get shaken out, aggressive shorts get trapped.
🟦 Patience remains the edge.
3 Day Chart : 2 Potential Long Opportunities
If the primary count is correct, two opportunities could emerge:
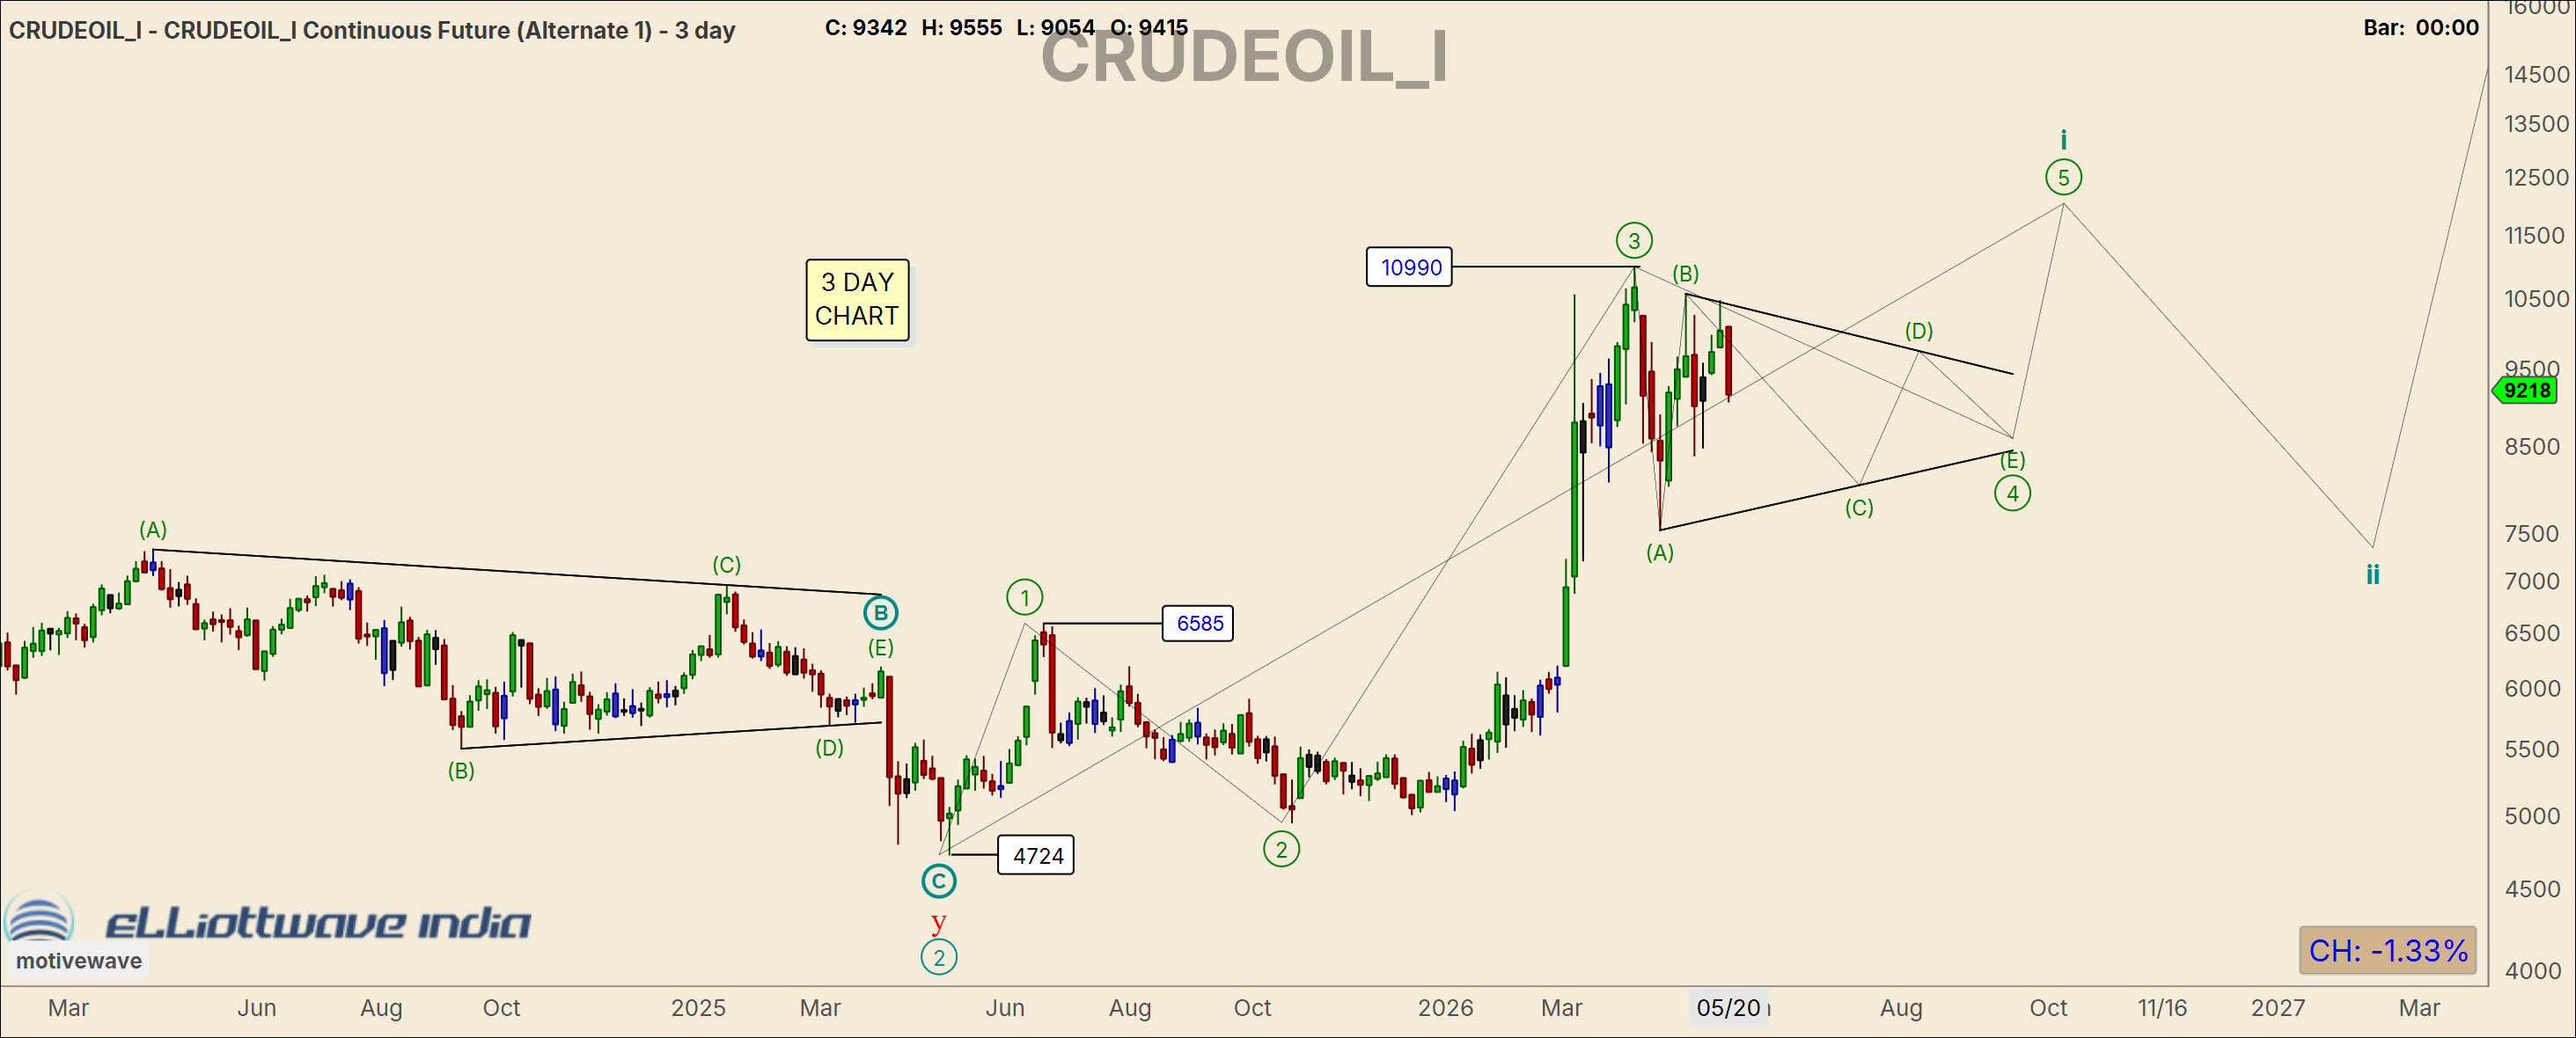
🔹 Wave E completion → Short term bullish trade
Completion of wave E (of 4) could produce a thrust higher to complete wave 5 of i.
This would likely be a tactical opportunity rather than the larger move.
🔹 Wave ii completion → Larger trend opportunity
The larger setup would emerge if price completes wave ii, opening the door for a strong wave iii advance.
Longer term upside projections can be refined if and when price confirms the pattern.
🟦 No confirmation = No trade.
Alternate Count (Equally Deserving Of Respect)
The alternate view cannot be dismissed.
The rally from 4724 → 10,990 has, so far, unfolded in 3 waves rather than 5.
If this interpretation is correct, 10,990 may already represent a completed wave B, implying the possibility of a much larger corrective decline.
3 Day Chart
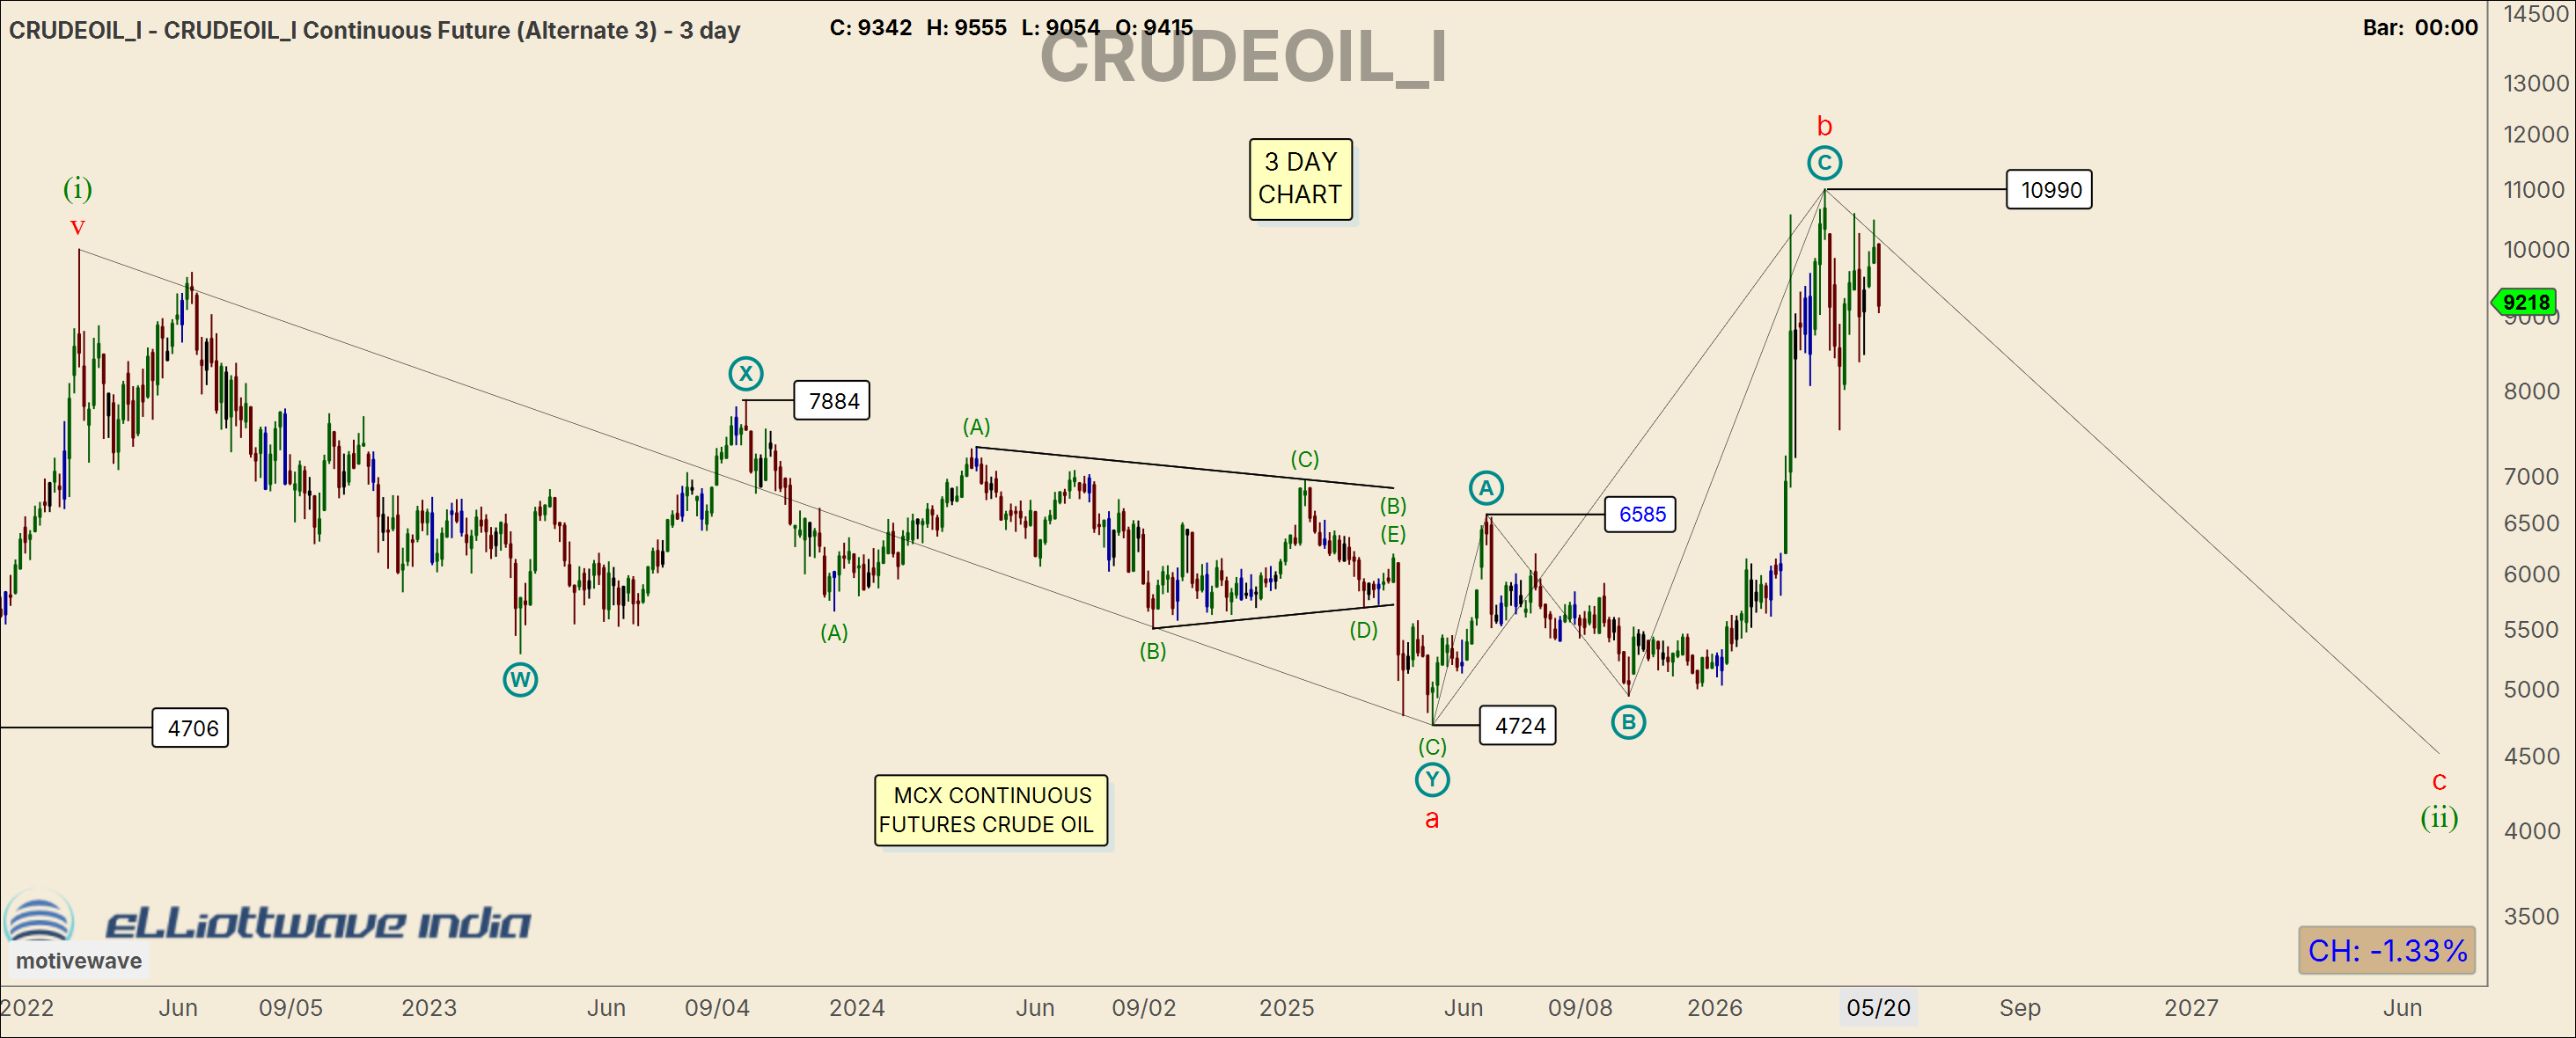
Under this count, Crude could be tracing a larger flat correction, with wave C of 2 potentially pulling price materially lower before the next major opportunity emerges.
Key Takeaway
🟦 This remains a decision point market, not a prediction market.
The objective is not to forecast first.
The objective is to identify structure, wait for confirmation and act only when probability shifts clearly in our favour.
🟦 Wait. Watch. Let Crude reveal its hand first.
Charting Platform
Charts shared here are built using MotiveWave, designed for structured analysis including Elliott Wave and time–price work.
If you’d like to explore the charting platform:
(Using this link may support the work shared here at no additional cost.)