Renuka Sugars - A Textbook Motive Wave (Interactive Education)
Real Market Chart from 2020 ~ 2022
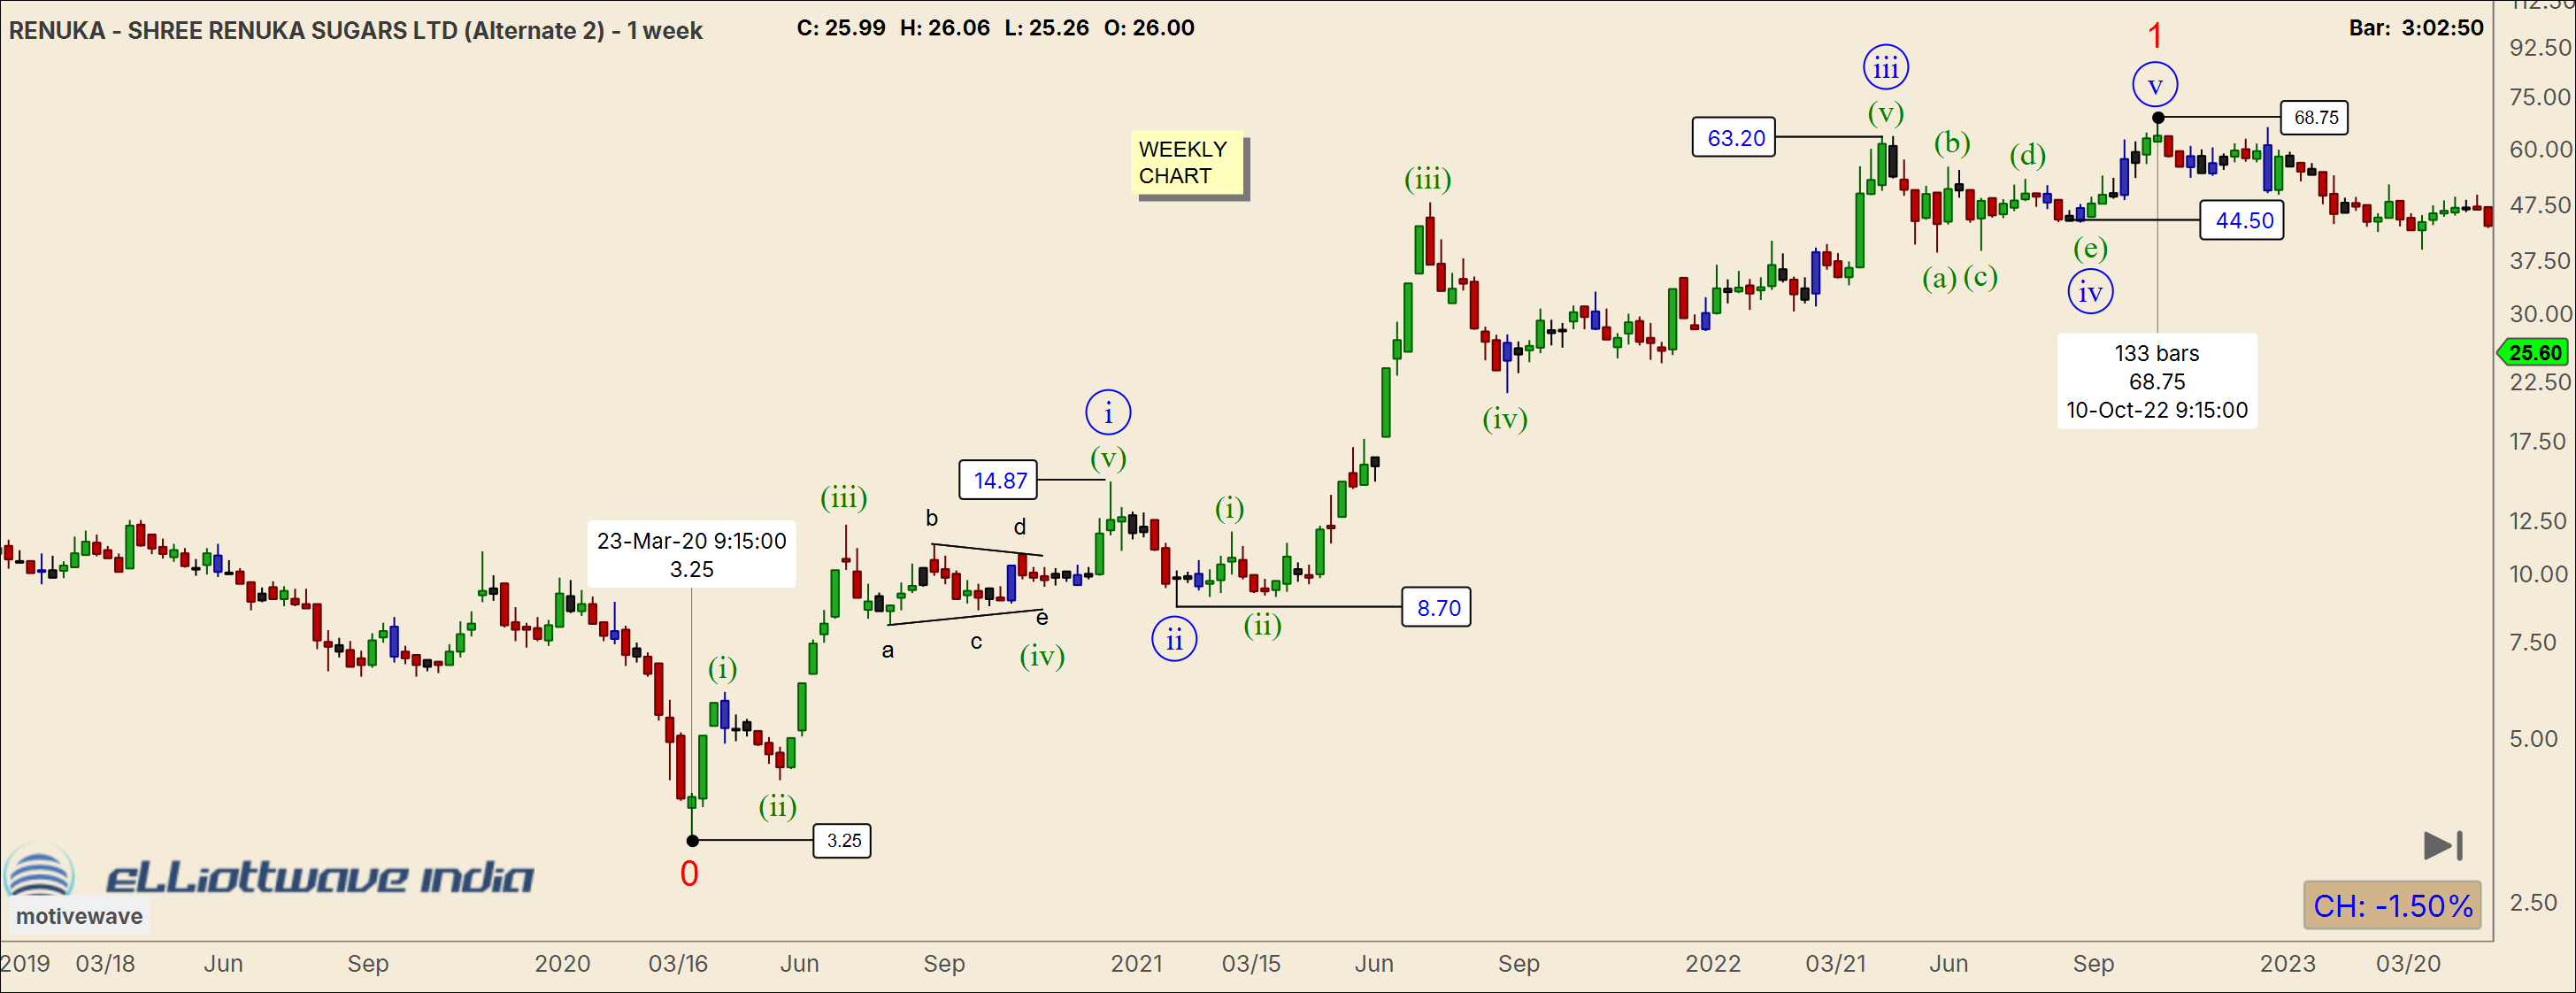
The original Renuka Sugars market structure has been reconstructed into an interactive chart below to better illustrate the progression of motive waves and corrective behaviour.
Elliott Wave India — Real Market Case Study · 02
Renuka Sugars — A Textbook Motive Wave
● Tap any highlighted point on the chart for details

0
(i)
(ii)
(iii)
(iv)
1
a
b
c
d
e
The Big Picture
Renuka Sugars bottomed at ₹3.25 on 23 March 2020 — the COVID pandemic low. From there it launched a primary wave 1 lasting 133 weeks, peaking at ₹68.75 on 10 October 2022 — a 21× gain.
The entire move is a textbook 5-wave motive impulse at the primary degree. Inside it, five intermediate sub-waves are visible: (i)(ii)(iii)(iv)(v). Each of these motive sub-waves itself contains five smaller waves — the fractal nature of Elliott Wave playing out at every degree simultaneously.
The entire impulse is contained within a rising parallel channel — a hallmark of a healthy, structured bull move.
Wave 1 origin
₹3.25
23 March 2020 · COVID low
Wave 1 peak
₹68.75
10 October 2022 · 133 weeks
Total gain
21× (2,015%)
In approximately 2.5 years
Internal structure
5-wave impulse
Sub-waves (i)(ii)(iii)(iv)(v) at intermediate degree
Wave (i) — The Trend Change Confirmation · ₹3.25 → ₹14.87
Wave (i) is the first rally from the COVID low — from ₹3.25 to ₹14.87. On its own, a single up-move from a low means nothing. What makes it decisive is its internal structure.
On the chart, wave (i) itself subdivides into five smaller waves — green (i)(ii)(iii)(iv)(v) visible at minor degree. This is the single most important signal on the entire chart. Corrective bounces within a downtrend subdivide into 3 waves. Motive waves in the direction of a new trend subdivide into 5 waves. The 5-wave internal structure of this first rally confirmed — before any news headline, before any analyst upgrade — that the bear market was over and a new primary bull trend had begun at ₹3.25.
On the chart, wave (i) itself subdivides into five smaller waves — green (i)(ii)(iii)(iv)(v) visible at minor degree. This is the single most important signal on the entire chart. Corrective bounces within a downtrend subdivide into 3 waves. Motive waves in the direction of a new trend subdivide into 5 waves. The 5-wave internal structure of this first rally confirmed — before any news headline, before any analyst upgrade — that the bear market was over and a new primary bull trend had begun at ₹3.25.
Inside wave (i) — the triangle in wave (iv): Within the five sub-waves of wave (i), the fourth sub-wave forms a small contracting triangle — labelled a-b-c-d-e on the chart. This is a valid corrective structure in the wave 4 position of the sub-wave sequence. Note: triangles are valid in wave 4 position. They are never valid as the entire wave 2 at any degree — which leads directly to the next step.
| Feature | What the chart shows | Significance |
|---|---|---|
| 5 sub-waves | Green (i)(ii)(iii)(iv)(v) inside wave (i) | Confirms motive structure → new bull trend confirmed |
| Triangle in sub-(iv) | a-b-c-d-e with channel lines inside wave (i) | Valid triangle in wave 4 position — thrust into sub-(v) follows |
| Sub-(ii) holds above ₹3.25 | First internal pullback stays above origin | Rule 1 satisfied at minor degree ✓ |
| Rising channel already forming | Channel lines visible from the very first sub-wave | Structure is orderly — not a random bounce |
The edge this gave: In mid-2020, the overwhelming narrative was bearish — COVID, economic collapse, lockdowns. The Elliott Wave analyst who identified the 5-wave structure of this first rally was positioned long before the crowd accepted the new trend. That is the practical value of wave structure analysis.
Wave (ii) — First Correction · ₹14.87 → ₹8.70
After wave (i)'s 5-wave impulse peaks at ₹14.87, wave (ii) corrects back to ₹8.70 — a retrace of approximately 42% of wave (i) in price terms. This is a straightforward corrective pullback, most likely a zigzag or flat structure.
Critical rule — triangles never appear as wave 2: A triangle is a pattern that involves five sub-waves in a 3-3-3-3-3 structure where each successive wave is smaller than the prior. Triangles only appear in specific positions: wave 4, wave B of a correction, or wave X in complex corrections. They never appear as the entire wave 2 at any degree. This is a hard structural rule. The triangle visible on this chart belongs to wave (iv) — not wave (ii).
Critical rule — triangles never appear as wave 2: A triangle is a pattern that involves five sub-waves in a 3-3-3-3-3 structure where each successive wave is smaller than the prior. Triangles only appear in specific positions: wave 4, wave B of a correction, or wave X in complex corrections. They never appear as the entire wave 2 at any degree. This is a hard structural rule. The triangle visible on this chart belongs to wave (iv) — not wave (ii).
Why wave (ii) cannot be a triangle: Wave 2 must be a sharp or sideways correction that retraces a meaningful portion of wave 1. A triangle is by definition a consolidating, non-trending structure — it does not produce the kind of price retrace that wave 2 requires. Elliott was explicit: triangles precede the final move in a sequence (wave 5 or the last wave in a correction). They do not follow the first wave.
Wave (ii) range
₹14.87 → ₹8.70
~42% retrace of wave (i). Valid — within 38–61.8% guideline
Rule satisfied
Stays above ₹3.25
Wave (ii) cannot breach wave (i)'s origin — rule holds ✓
What (ii) is NOT
Not a triangle
Triangles never appear as wave 2. The triangle on this chart is wave (iv)
Likely structure
Zigzag or flat
3-wave A-B-C correction — the standard wave 2 structure
Wave (iii) — The Powerhouse · ₹8.70 → ₹63.20
Wave (iii) travels from ₹8.70 to ₹63.20 — a gain of ₹54.50 (626%) from the wave (ii) low. This is the longest and most powerful leg of the entire primary wave 1, as required by Elliott Wave rules.
Inside wave (iii), the chart shows blue-circled sub-waves (i)(ii)(iii)(iv)(v) at the intermediate degree. The blue (iii) marks the most powerful sub-wave — this is the (iii) of (iii), the most explosive point in the entire sequence. Volume is at its peak here, candlesticks are large and bullish, and the angle of ascent is steepest.
Inside wave (iii), the chart shows blue-circled sub-waves (i)(ii)(iii)(iv)(v) at the intermediate degree. The blue (iii) marks the most powerful sub-wave — this is the (iii) of (iii), the most explosive point in the entire sequence. Volume is at its peak here, candlesticks are large and bullish, and the angle of ascent is steepest.
The (iii) of (iii) concept: In any Elliott Wave sequence, the most explosive moment is wave 3 of wave 3 at any degree. On Renuka this is the blue circled (iii) inside the larger green (iii). By the time this point is reached, the broad market has accepted the uptrend and volume surges. This is also when most late-cycle momentum traders enter — well after the optimal entry at the wave (ii) low.
Wave (iii) range
₹8.70 → ₹63.20
₹54.50 gain · 626% · the longest sub-wave ✓
(iii) of (iii)
Most explosive point
Blue circled (iii) inside wave (iii) — peak momentum on the chart
Internal structure
5 sub-waves
Blue (i)(ii)(iii)(iv)(v) confirm impulse character at intermediate degree
Fibonacci
>1.618× wave (i)
Extended wave (iii) — typical in strong first-wave-of-a-cycle sequences
Wave (iv) — The Triangle · ₹63.20 → ₹44.50
After wave (iii) peaks at ₹63.20, wave (iv) corrects in a contracting triangle — labelled (a)(b)(c)(d)(e) with converging channel lines clearly visible on the chart. The triangle low is ₹44.50.
This is the correct position for a triangle. Triangles appear in wave 4 (never wave 2), wave B, or complex correction positions. Seeing a textbook triangle in wave (iv) is strong structural confirmation that: (1) the prior wave (iii) count is correct, and (2) wave (v) is next — the triangle is the final pause before the terminal wave.
This is the correct position for a triangle. Triangles appear in wave 4 (never wave 2), wave B, or complex correction positions. Seeing a textbook triangle in wave (iv) is strong structural confirmation that: (1) the prior wave (iii) count is correct, and (2) wave (v) is next — the triangle is the final pause before the terminal wave.
The triangle thrust into wave (v): After the e-wave of the triangle completes at ₹44.50, price thrusts sharply higher into wave (v). Triangle thrusts are among the most reliable setups in Elliott Wave — the e-wave completion is the entry trigger. The minimum thrust target equals the widest part of the triangle added to the e-wave breakout point.
No-overlap rule satisfied: The entire triangle, including its deepest point at ₹44.50, stays well above wave (i)'s peak at ₹14.87. The hard rule — wave 4 cannot enter wave 1's territory — is clearly satisfied with substantial margin.
Structure
Contracting triangle
(a)(b)(c)(d)(e) with converging channel lines · 3-3-3-3-3 internally
Triangle range
₹63.20 → ₹44.50
e-wave low = thrust entry trigger
No-overlap confirmed
₹44.50 >> ₹14.87
Wave (iv) stays well above wave (i) peak — rule satisfied ✓
What follows
Wave (v) thrust
Triangle always precedes the final move in a sequence
Wave (v) — Final Push · ₹44.50 → ₹68.75
Wave (v) thrusts from the triangle low at ₹44.50 up to ₹68.75 — a gain of ₹24.25 completing the entire primary wave 1. The blue circled (v) marks the sub-wave peak, and the red "1" confirms this entire move from ₹3.25 is wave 1 of an even larger degree bull sequence.
The chart shows wave (v) also subdividing internally into 5 sub-waves — again confirming impulse character. The peak at ₹68.75 touches near the upper boundary of the rising parallel channel, a classic exhaustion signal.
The chart shows wave (v) also subdividing internally into 5 sub-waves — again confirming impulse character. The peak at ₹68.75 touches near the upper boundary of the rising parallel channel, a classic exhaustion signal.
Exhaustion signals at wave (v): Two key signals mark wave (v) completion — (1) the upper channel line touch at ₹68.75, and (2) momentum divergence: while price was making a new high above wave (iii), oscillators like RSI would show a lower high, indicating the market is taking more effort to make less price progress. These are the warning signals to exit longs and prepare for the larger wave 2 correction.
Wave (v) range
₹44.50 → ₹68.75
₹24.25 gain from triangle thrust low
Exhaustion signal 1
Upper channel touch
Wave (v) terminates at upper parallel channel boundary
Exhaustion signal 2
Momentum divergence
Price new high; oscillators (RSI/MACD) lower high
Degree implication
Red "1" complete
Entire ₹3.25→₹68.75 = Wave 1 of larger bull sequence
Rule Verification — Is This a Valid Impulse?
All three hard Elliott Wave impulse rules are checked against the actual prices from the chart.
✓Rule 1 — Wave (ii) does not retrace 100% of wave (i). Wave (ii) corrects from ₹14.87 to ₹8.70 — a 42% retrace. It stays well above the origin at ₹3.25. Rule satisfied.
✓Rule 2 — Wave (iii) is not the shortest wave. Wave (iii) = ₹54.50 (₹8.70→₹63.20). Wave (i) = ₹11.62. Wave (v) = ₹24.25. Wave (iii) is by far the longest. Rule satisfied.
✓Rule 3 — Wave (iv) does not enter wave (i)'s territory. Wave (iv) low = ₹44.50. Wave (i) peak = ₹14.87. ₹44.50 is well above ₹14.87 — no overlap. Rule satisfied with large margin.
✓Wave (v) makes a new high above wave (iii). Wave (v) = ₹68.75 vs wave (iii) = ₹63.20. New high confirmed. Rule satisfied.
✓Triangle correctly placed in wave (iv). The contracting triangle a-b-c-d-e is in wave 4 position — the only valid position for a triangle within an impulse. It is not in wave 2. All structural rules for the triangle are satisfied.
✓Wave (i) subdivides into 5 waves. Internal (i)(ii)(iii)(iv)(v) visible — confirms motive character of the first rally and signals the trend change from bearish to bullish at the primary degree.
Verdict: All three hard rules are satisfied. The count is a valid 5-wave impulse at the primary degree. The "Alternate 2" label on the MotiveWave chart indicates this is one of two counts being monitored — both agree the structure is bullish; they differ in the degree labelling of the larger sequence.
What Comes Next — The Roadmap After Wave 1
After a completed 5-wave primary impulse, the roadmap is clear: a primary wave 2 correction must follow. This will be a 3-wave A-B-C corrective sequence moving against the entire ₹3.25→₹68.75 impulse.
The correct stance near or after the end of wave 1 is to stand aside from an investment perspective. The impulse is complete. Chasing longs after wave (v) exhaustion signals — upper channel touch, momentum divergence — means buying into a correction that could retrace 38–62% of the prior move. The patient investor waits for wave 2 to complete before re-entering.
The correct stance near or after the end of wave 1 is to stand aside from an investment perspective. The impulse is complete. Chasing longs after wave (v) exhaustion signals — upper channel touch, momentum divergence — means buying into a correction that could retrace 38–62% of the prior move. The patient investor waits for wave 2 to complete before re-entering.
Corrections are not always just about price — they can be price-based, time-based, or a combination of both:
| Correction type | What it looks like | Implication |
|---|---|---|
| Price-based | Price retraces 38.2–61.8% of wave 1. Relatively quick. Sharp zigzag structure. | Fast and deep — typical after a strong extended wave 3. Re-entry opportunity comes sooner. |
| Time-based | Price barely retraces but the correction takes many months — a shallow flat or sideways structure. | Price holds up but time is passing. Frustrating for bulls. The correction is playing out via time, not price. |
| Price + time | A complex correction — W-X-Y or double/triple three — that retraces meaningfully and takes a long time. | Most common after a large primary impulse. Patient investors who wait are rewarded at the wave 2 low. |
Wave 2 price retrace targets from ₹68.75:
38.2% retrace
≈ ₹43.70
Shallow — typical if wave 1 was extended and wave 3 was shortest
50% retrace
≈ ₹36.00
Most common wave 2 retrace — the midpoint of wave 1
61.8% retrace
≈ ₹28.25
Deep but valid — common after a swift wave 1
Invalidation
Below ₹3.25
Wave 2 cannot breach wave 1's origin — ever. Below ₹3.25 = count invalid
The larger implication — only wave 1 is done: If the entire ₹3.25→₹68.75 move is only primary wave 1, waves 3, 4, and 5 of the primary degree are still ahead. Primary wave 3 at minimum will exceed ₹68.75 — and given the structure of this particular impulse (with wave (iii) being the most powerful and extended), primary wave 3 could be the most explosive leg of the entire cycle. The best entry for that wave 3 is at the completion of the wave 2 correction now underway.
Note: Elliott Wave India strictly follows SEBI guidelines relating to educational market content and analysis. At time of publication of this update, prices of the last 3 months have not been shown.