Nifty Short Term : Triangle Structure Suggests Final Leg Before Reversal
As on Tue 5 May 2026 | CMP: 24,033 | Posted at 2:00 pm IST
💡
This premium update has been made public for study and educational purposes on 10 July 2026. Please note: This analysis reflects the market structure as of its original publication date (more than 2 months ago). Price action and wave counts will have evolved; do not use this historical analysis for live trading decisions.
Bottom Line
Nifty remains within a corrective phase in the near term.
The structure suggests further consolidation / downside before the next directional move higher.
Primary Count (Preferred View)
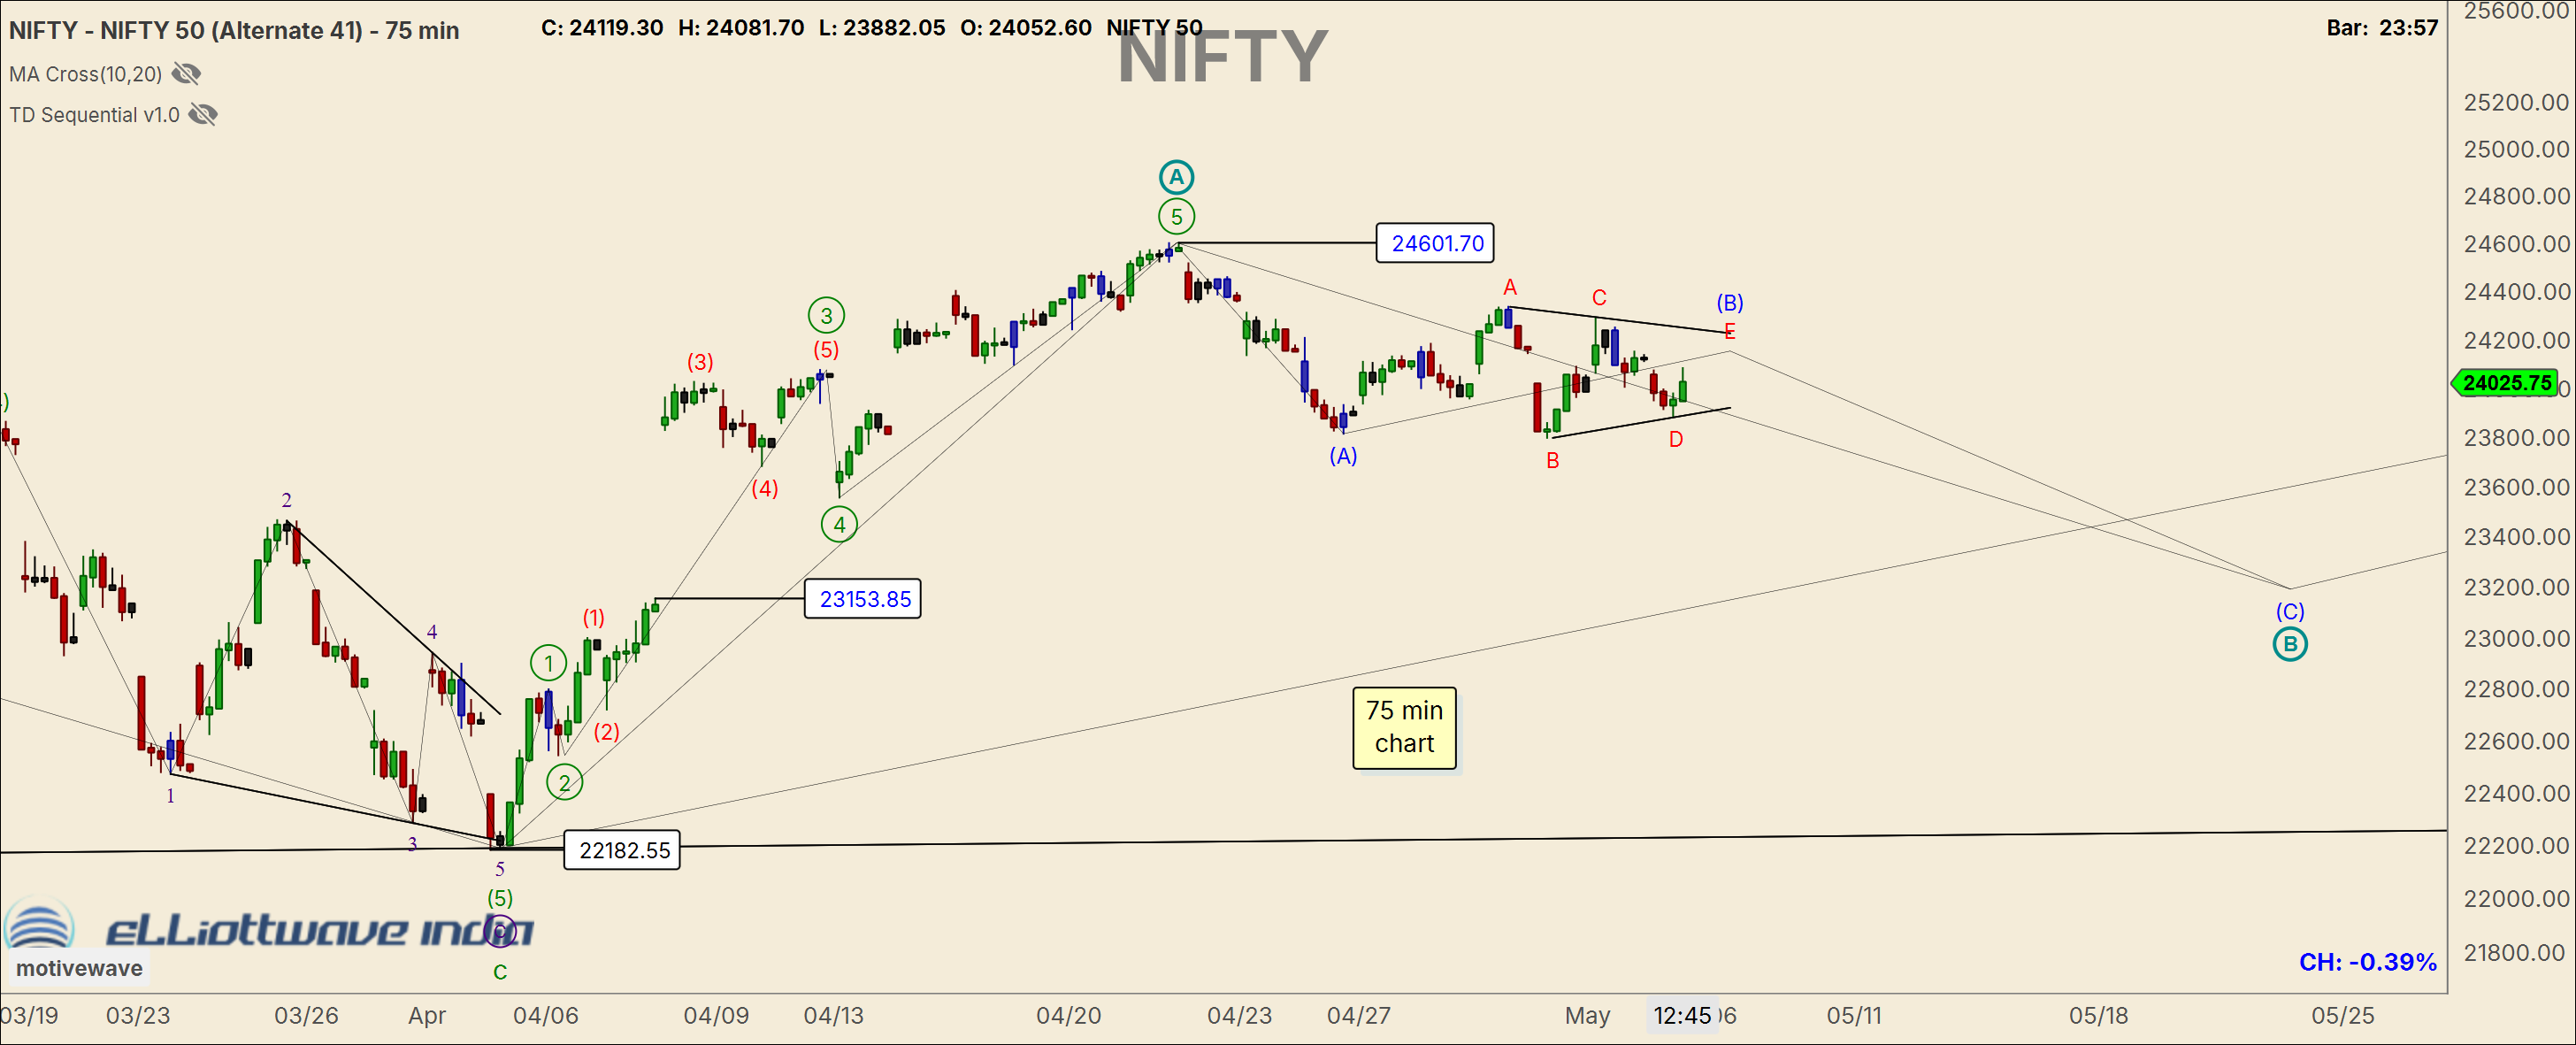
- On the 75 min chart, price appears to be unfolding wave E of a bearish triangle.
- This structure typically resolves with a final thrust lower.
👉 Expected move:
A decline towards 23,100 – 23,200
- This would complete wave (C) of circle wave B.
- Following this, a trend reversal higher is expected.
Higher Timeframe Structure
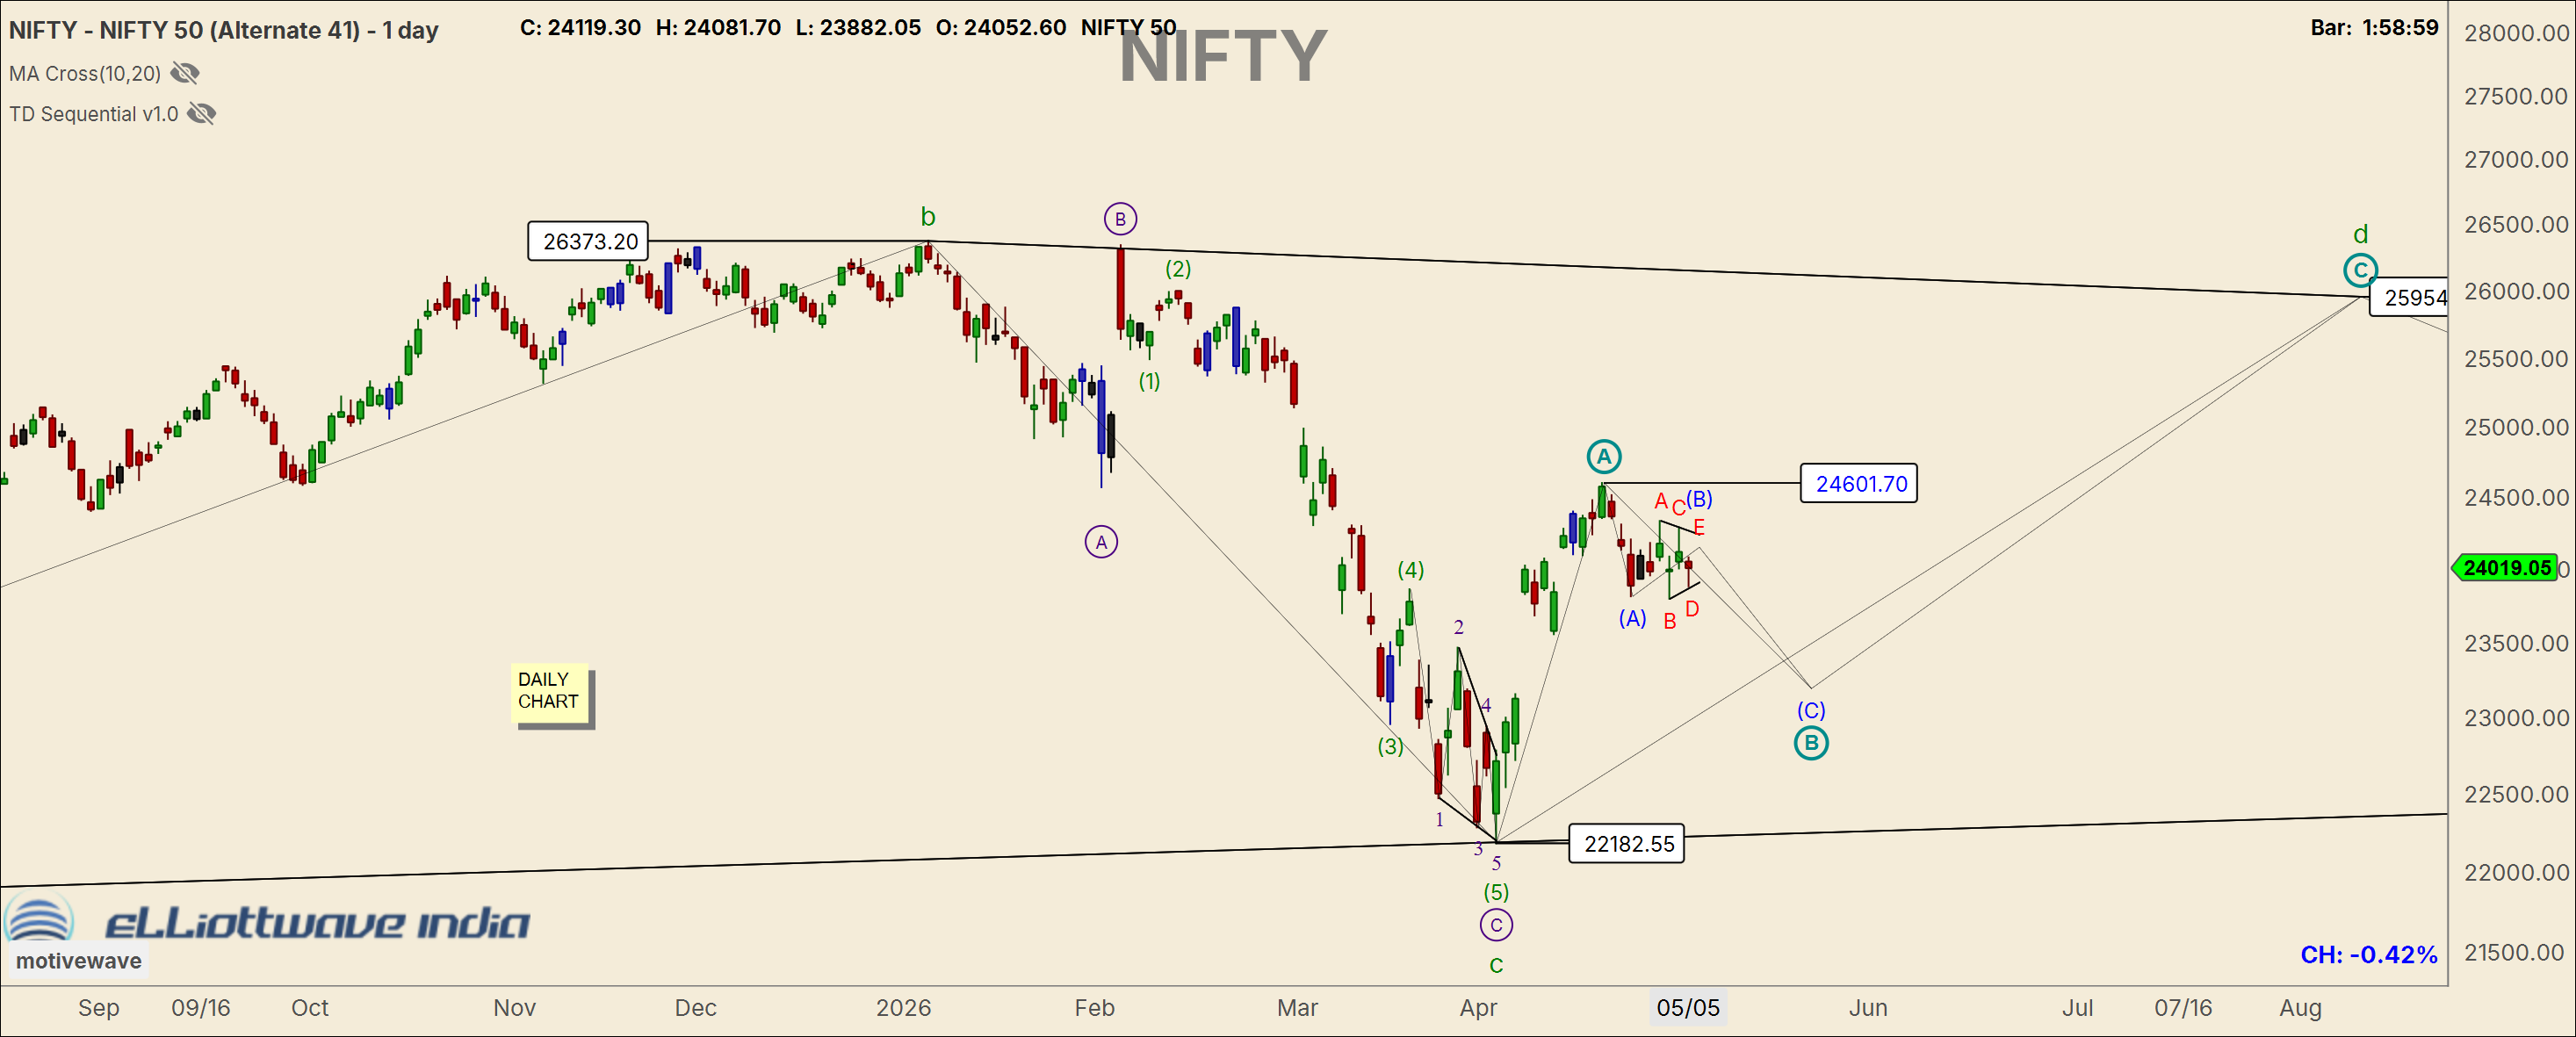
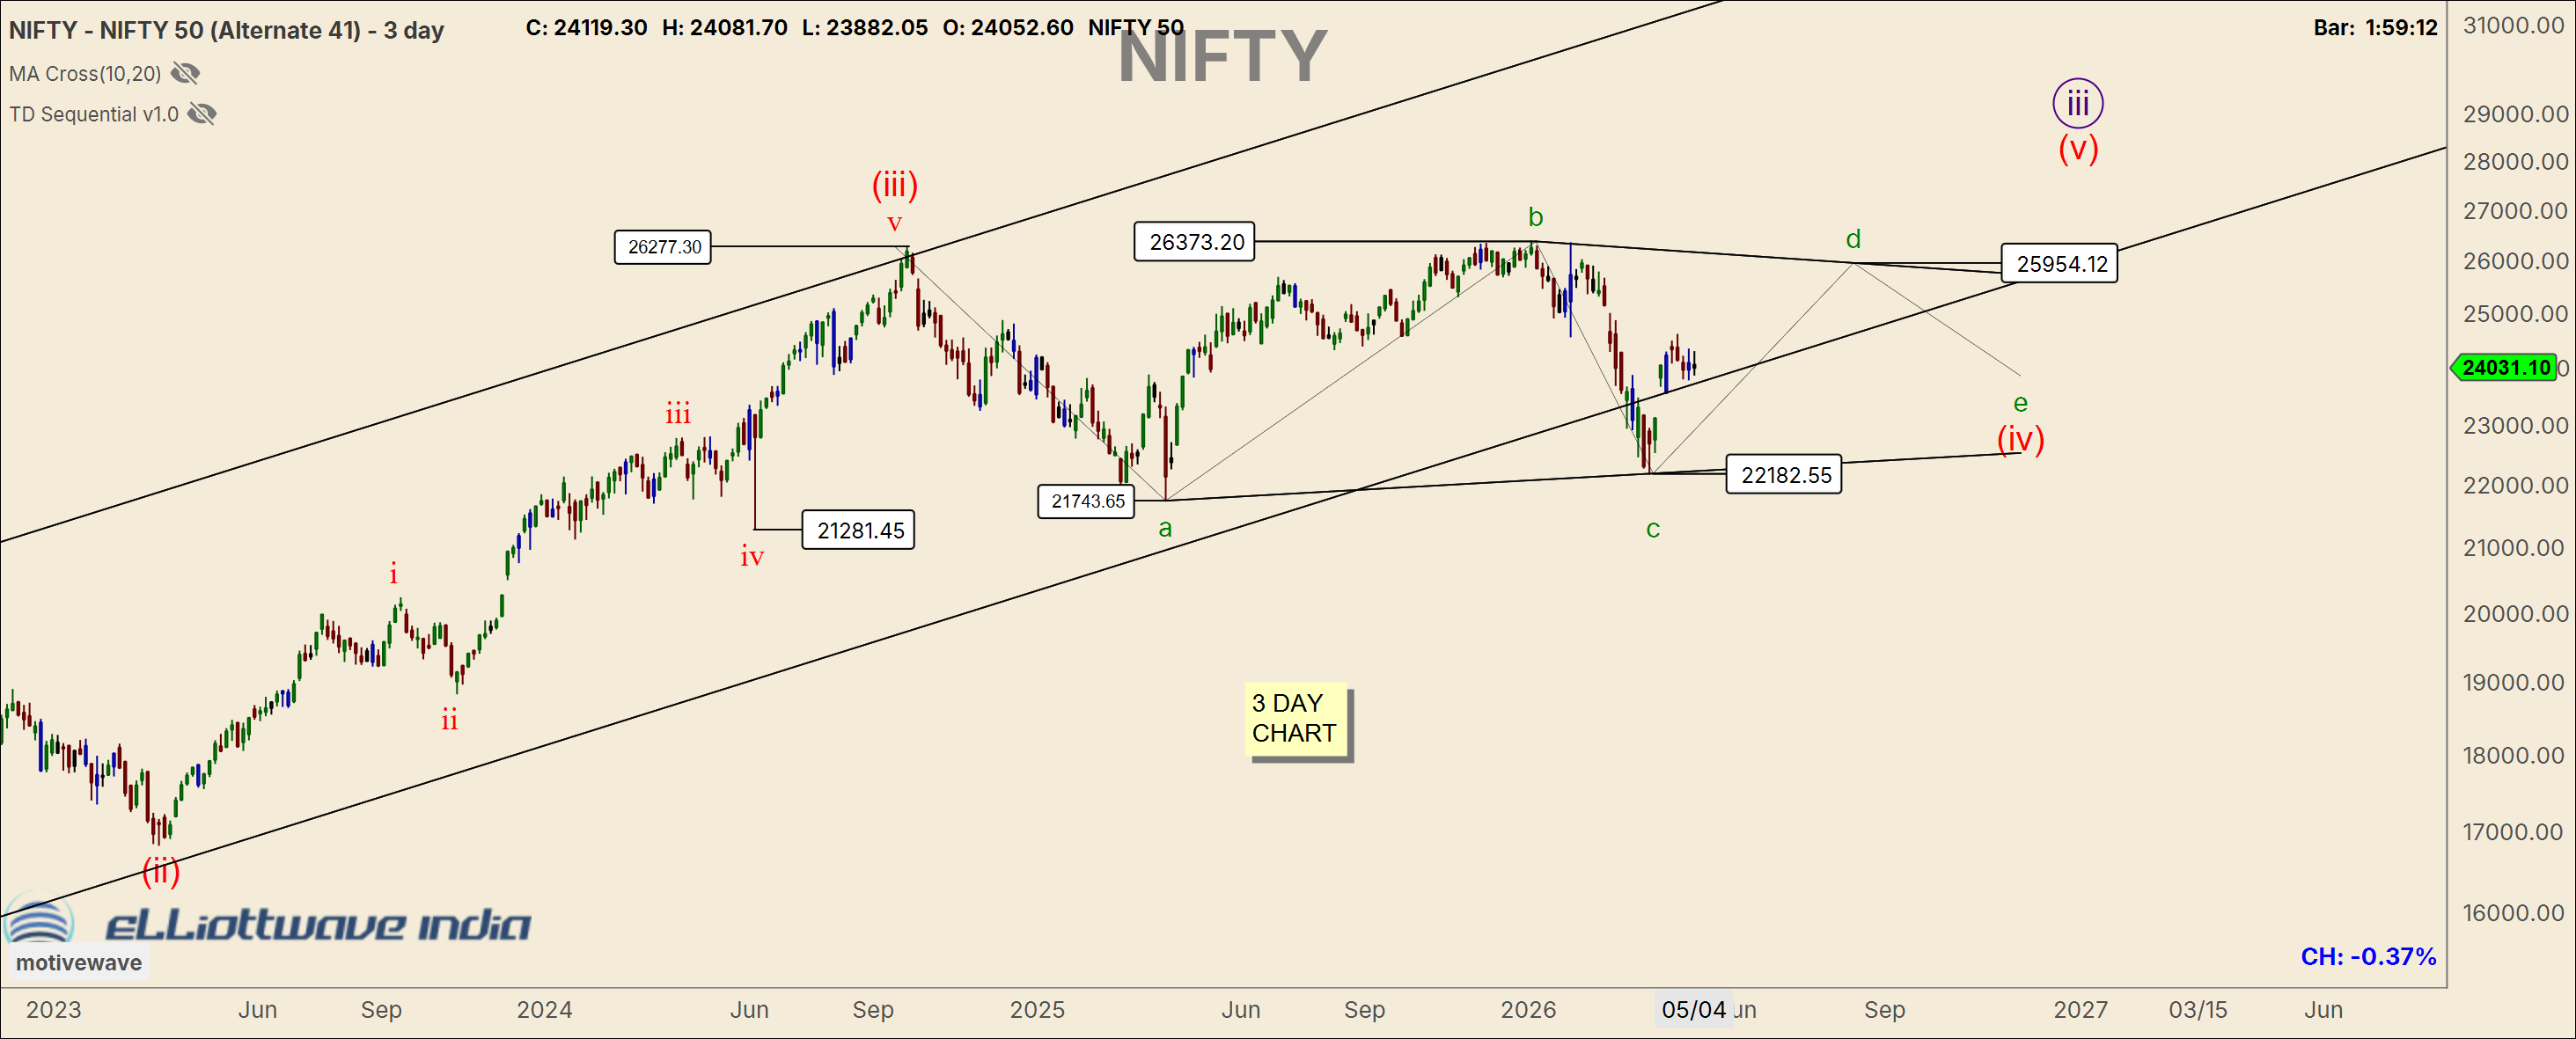
- On the Daily and 3-Day charts:
- The larger wave C appears complete at 22,182.
- Price is now likely progressing within wave D of a larger bullish triangle.
👉 Implication:
- Medium-term structure remains constructive
- Upside towards 25,000+ remains a valid expectation after completion of the current correction
Alternate Count :
- Larger structure remains unchanged (bullish triangle – wave D)
- However, near-term price action could differ:
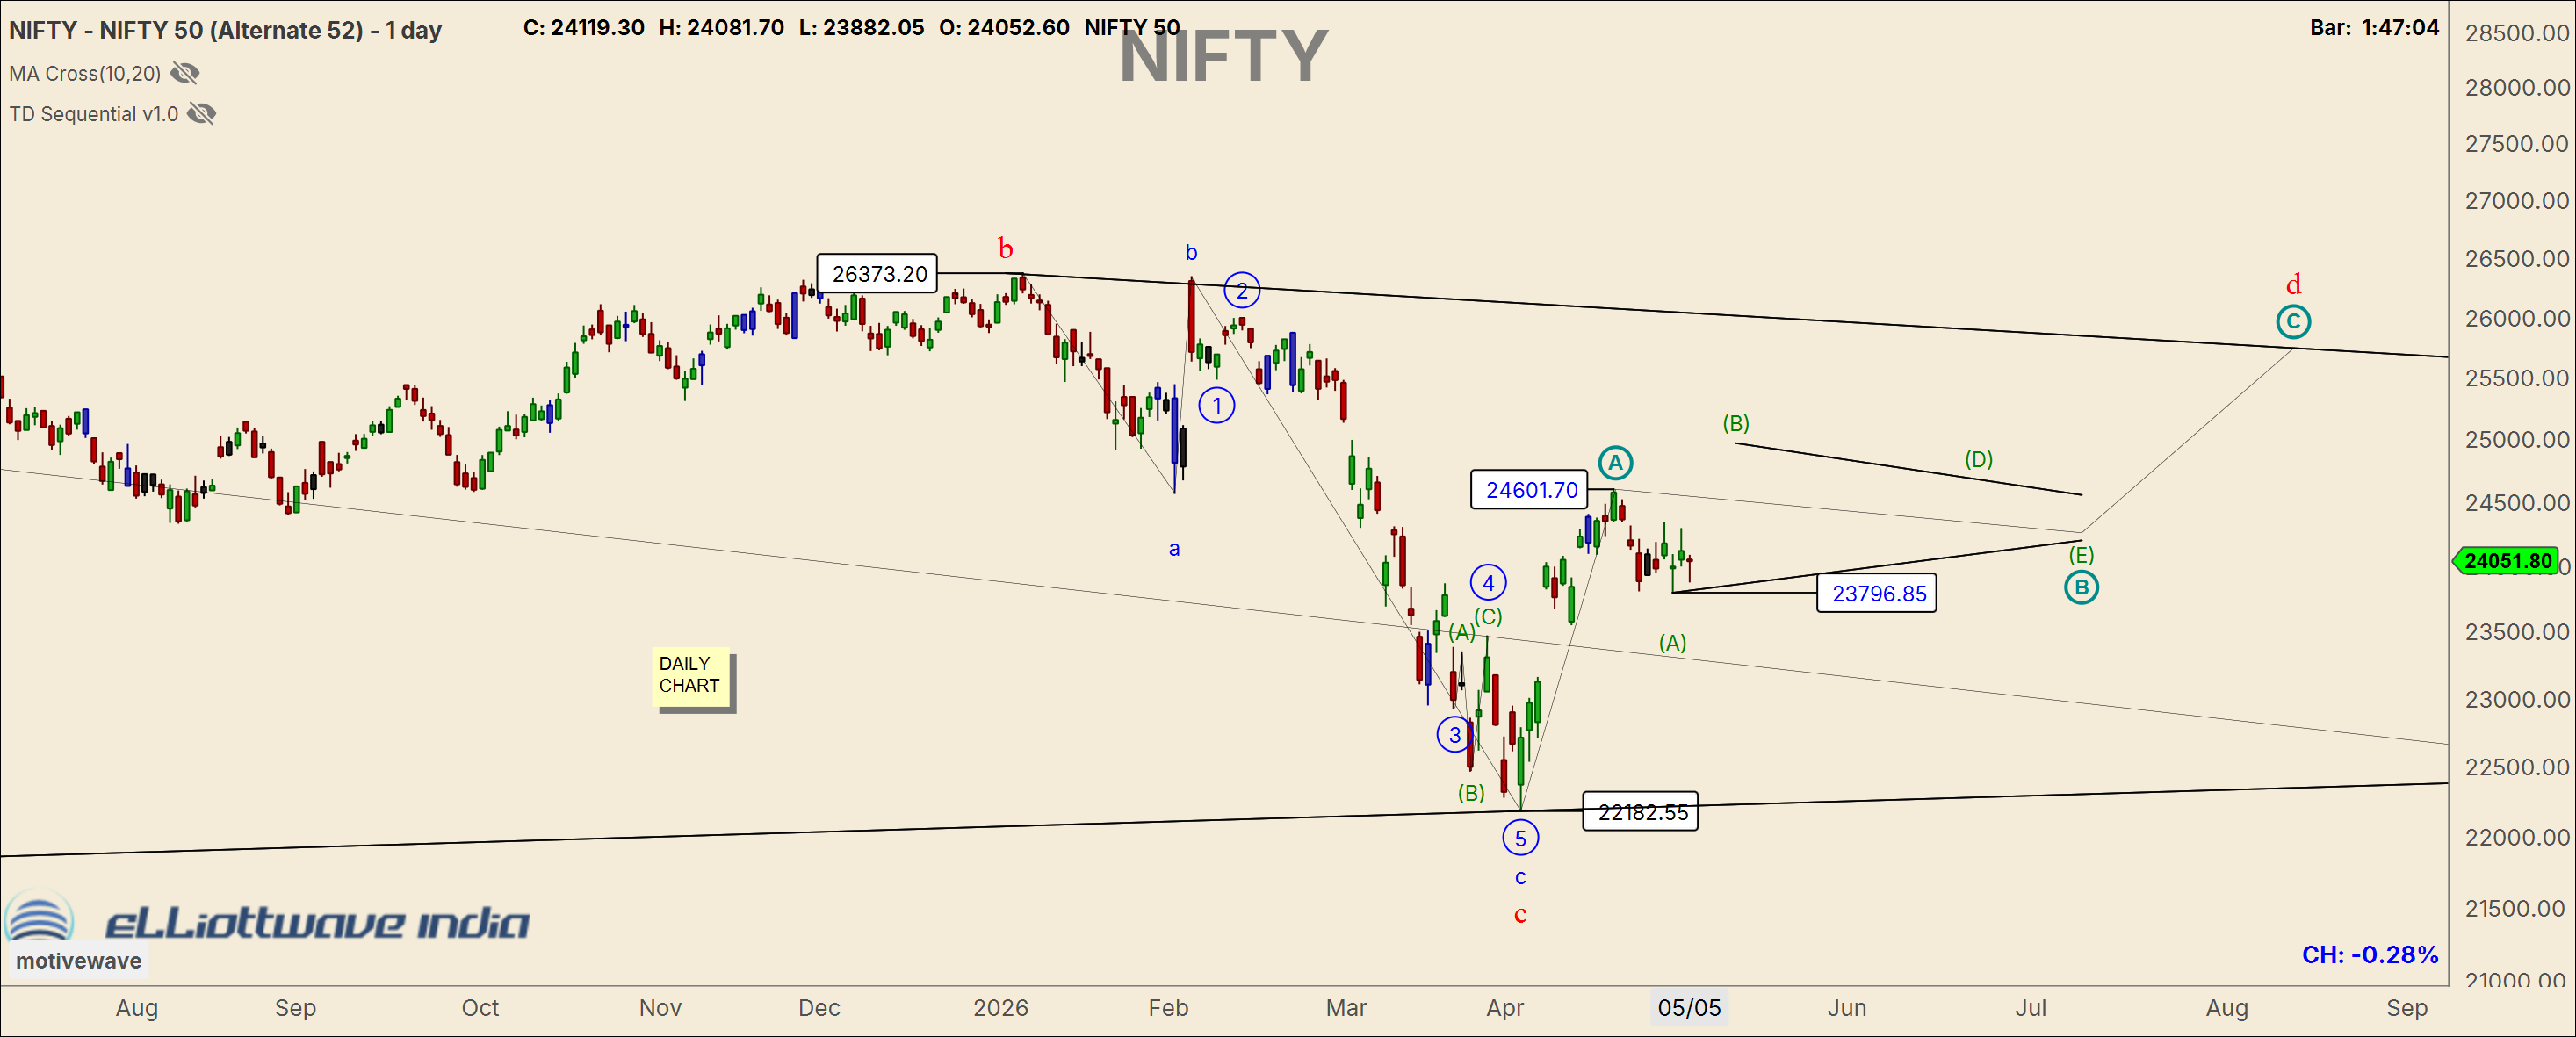
👉 If price moves above 24,601 quickly:
- The current consolidation may instead be:
- a smaller bullish triangle, or
- a flat correction
👉 This would imply:
- earlier upside continuation
- without the deeper dip towards 23,100–23,200
Key Takeaway
- Short term: corrective, with downside risk still present
- Medium term: structure remains bullish
- Trigger level: 24,601 — breaks the immediate bearish expectation