Bank Nifty Update
Bank Nifty Update
As on Monday, 20 April 2026
CMP: 56,565
Posted at: 9:00 AM
Bottom Line (Key Takeaway).
Bank Nifty remains structurally bullish.
A larger Wave 4 low is likely in place at 49,954, and the index appears to be transitioning into a larger degree Wave 5 advance, with an eventual target in the 65,000 – 70,000 zone.
Primary Count
The broader structure continues to support a bullish interpretation across timeframes.
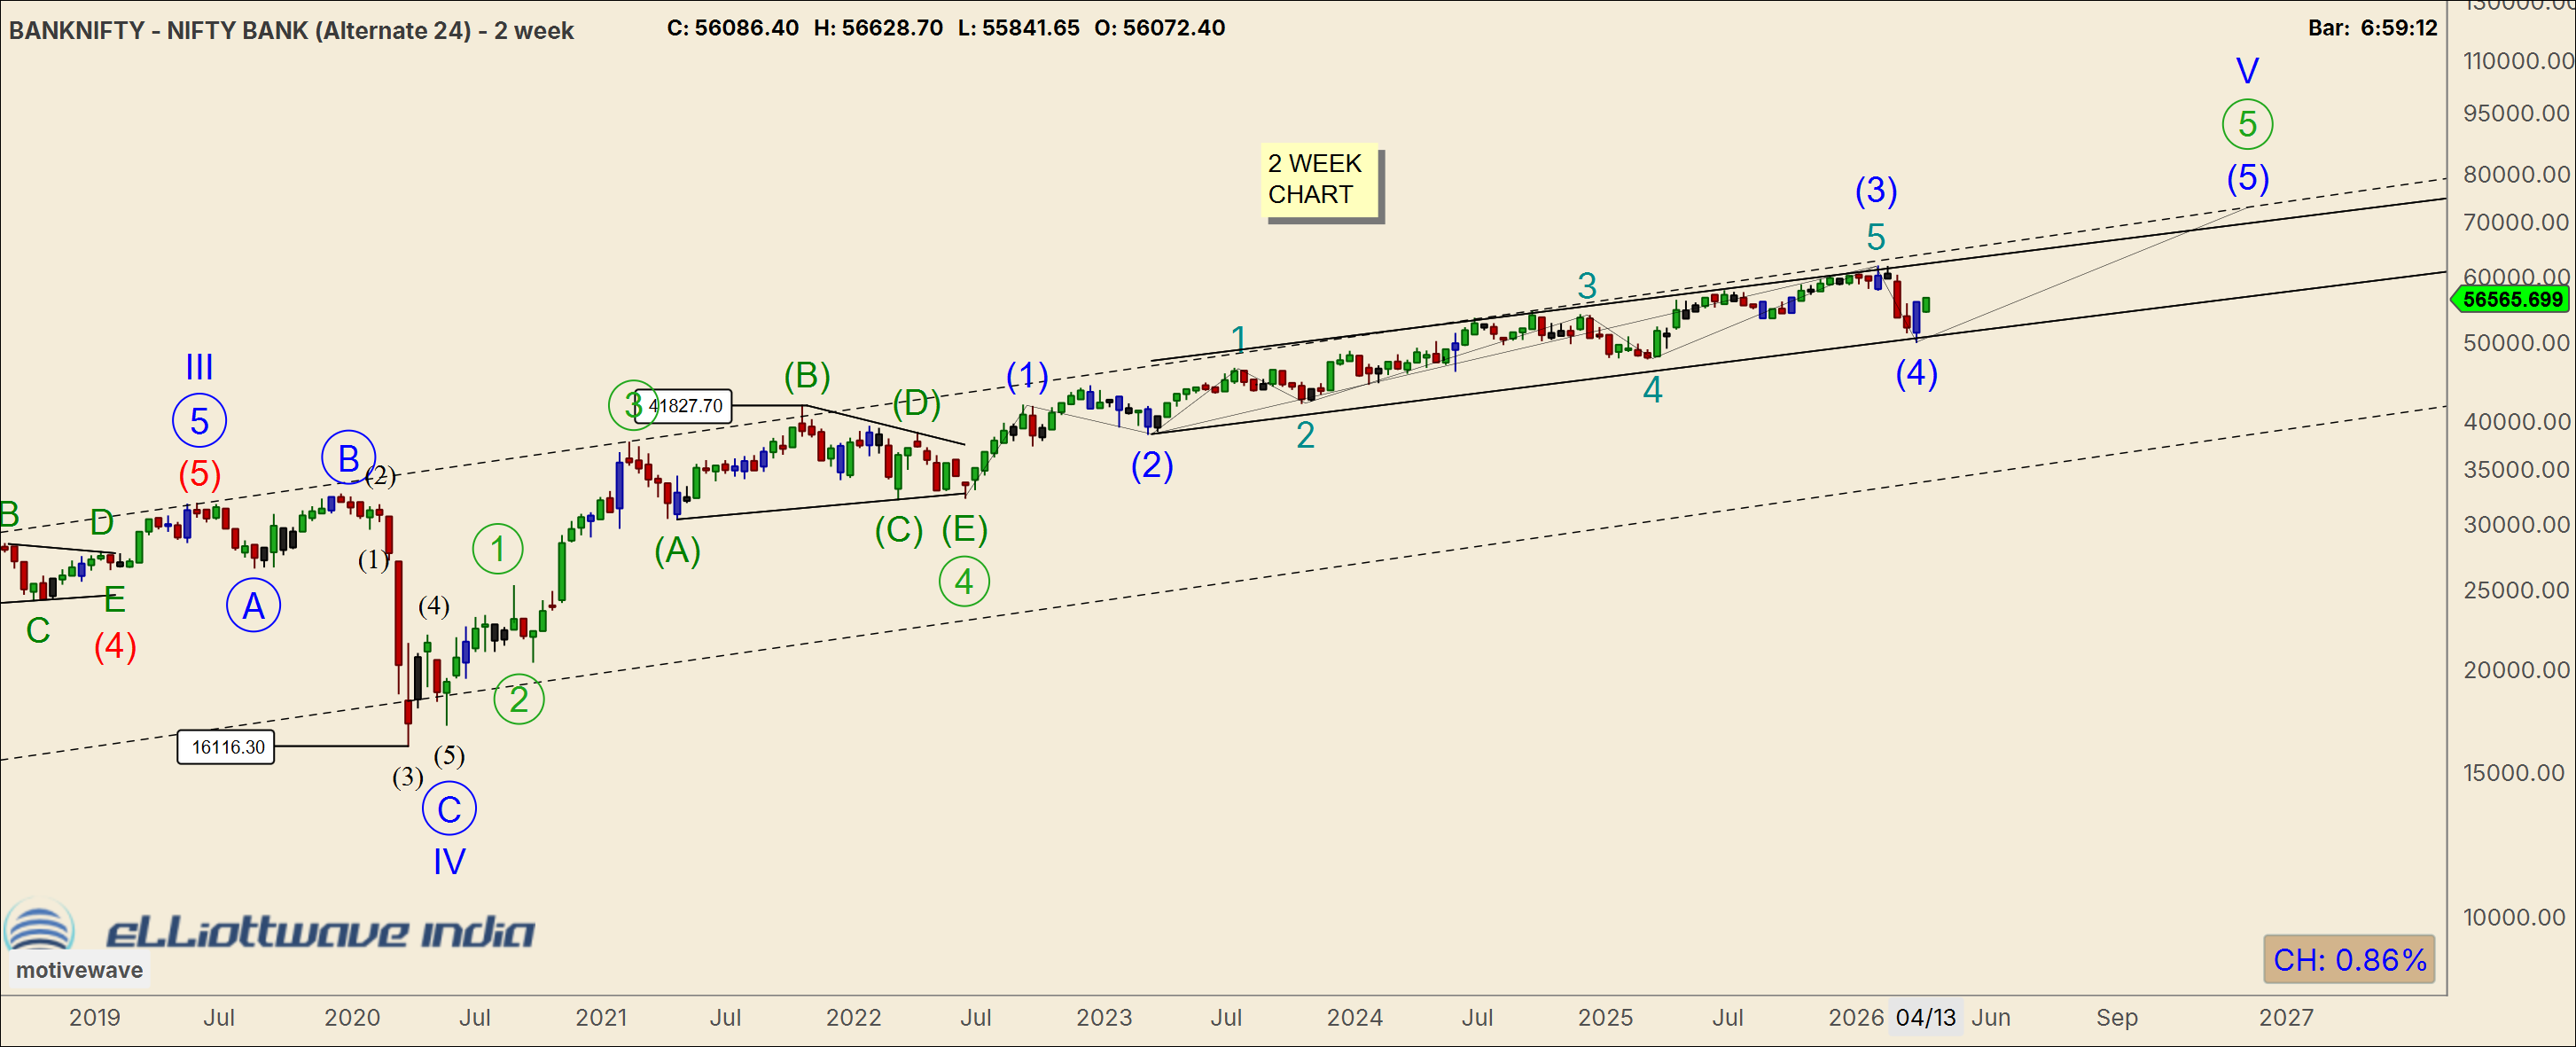
2-Week Chart
Wave 4 has cleanly tested the lower boundary of the rising channel, reinforcing the idea of a completed corrective phase. This is textbook behaviour for a fourth wave within a trending structure.
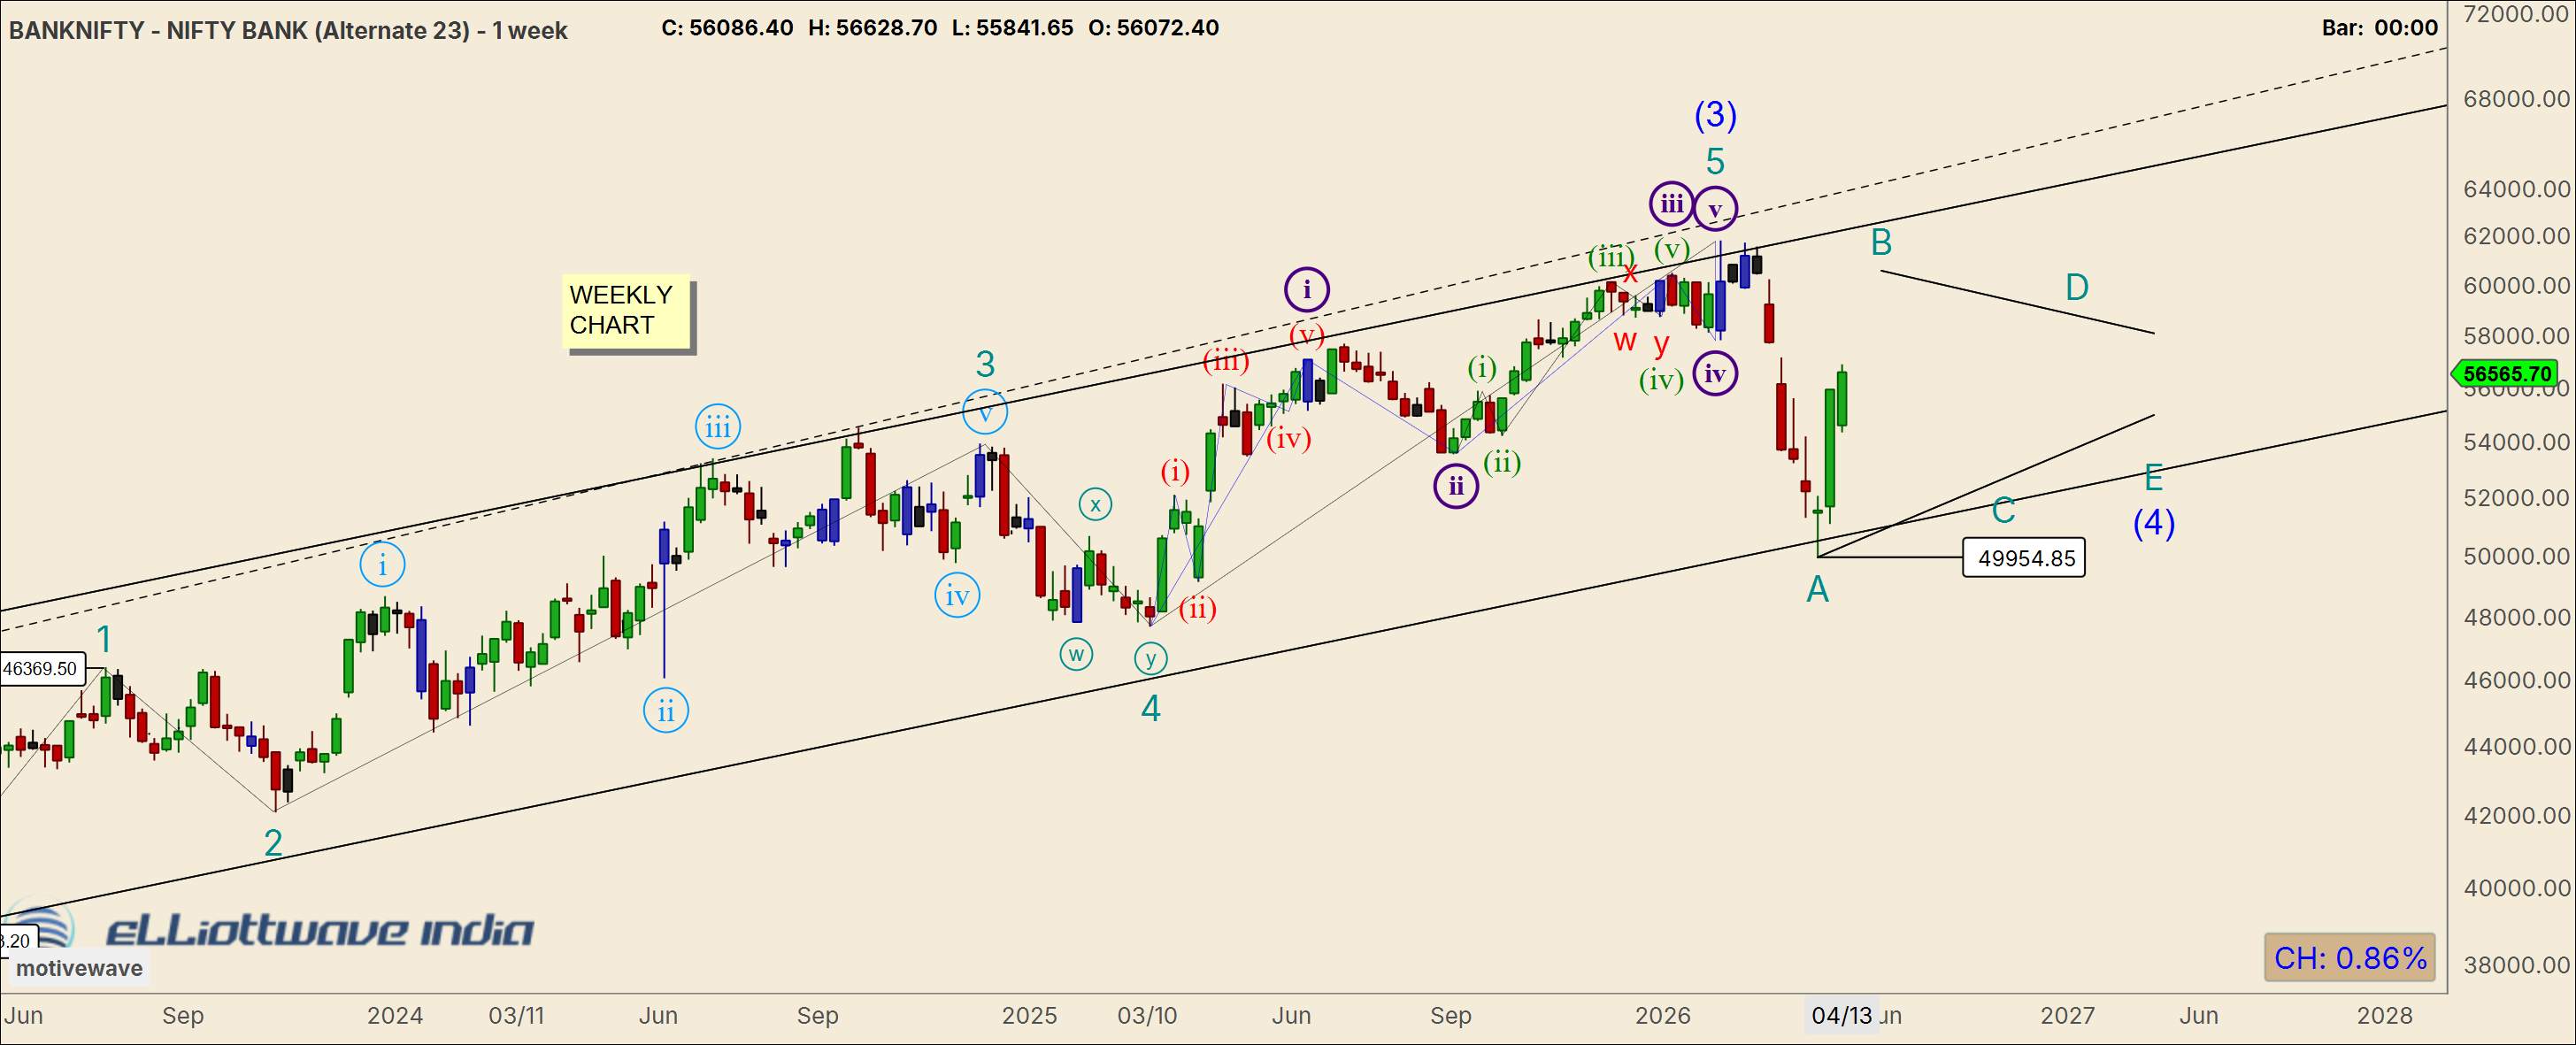
Weekly Chart
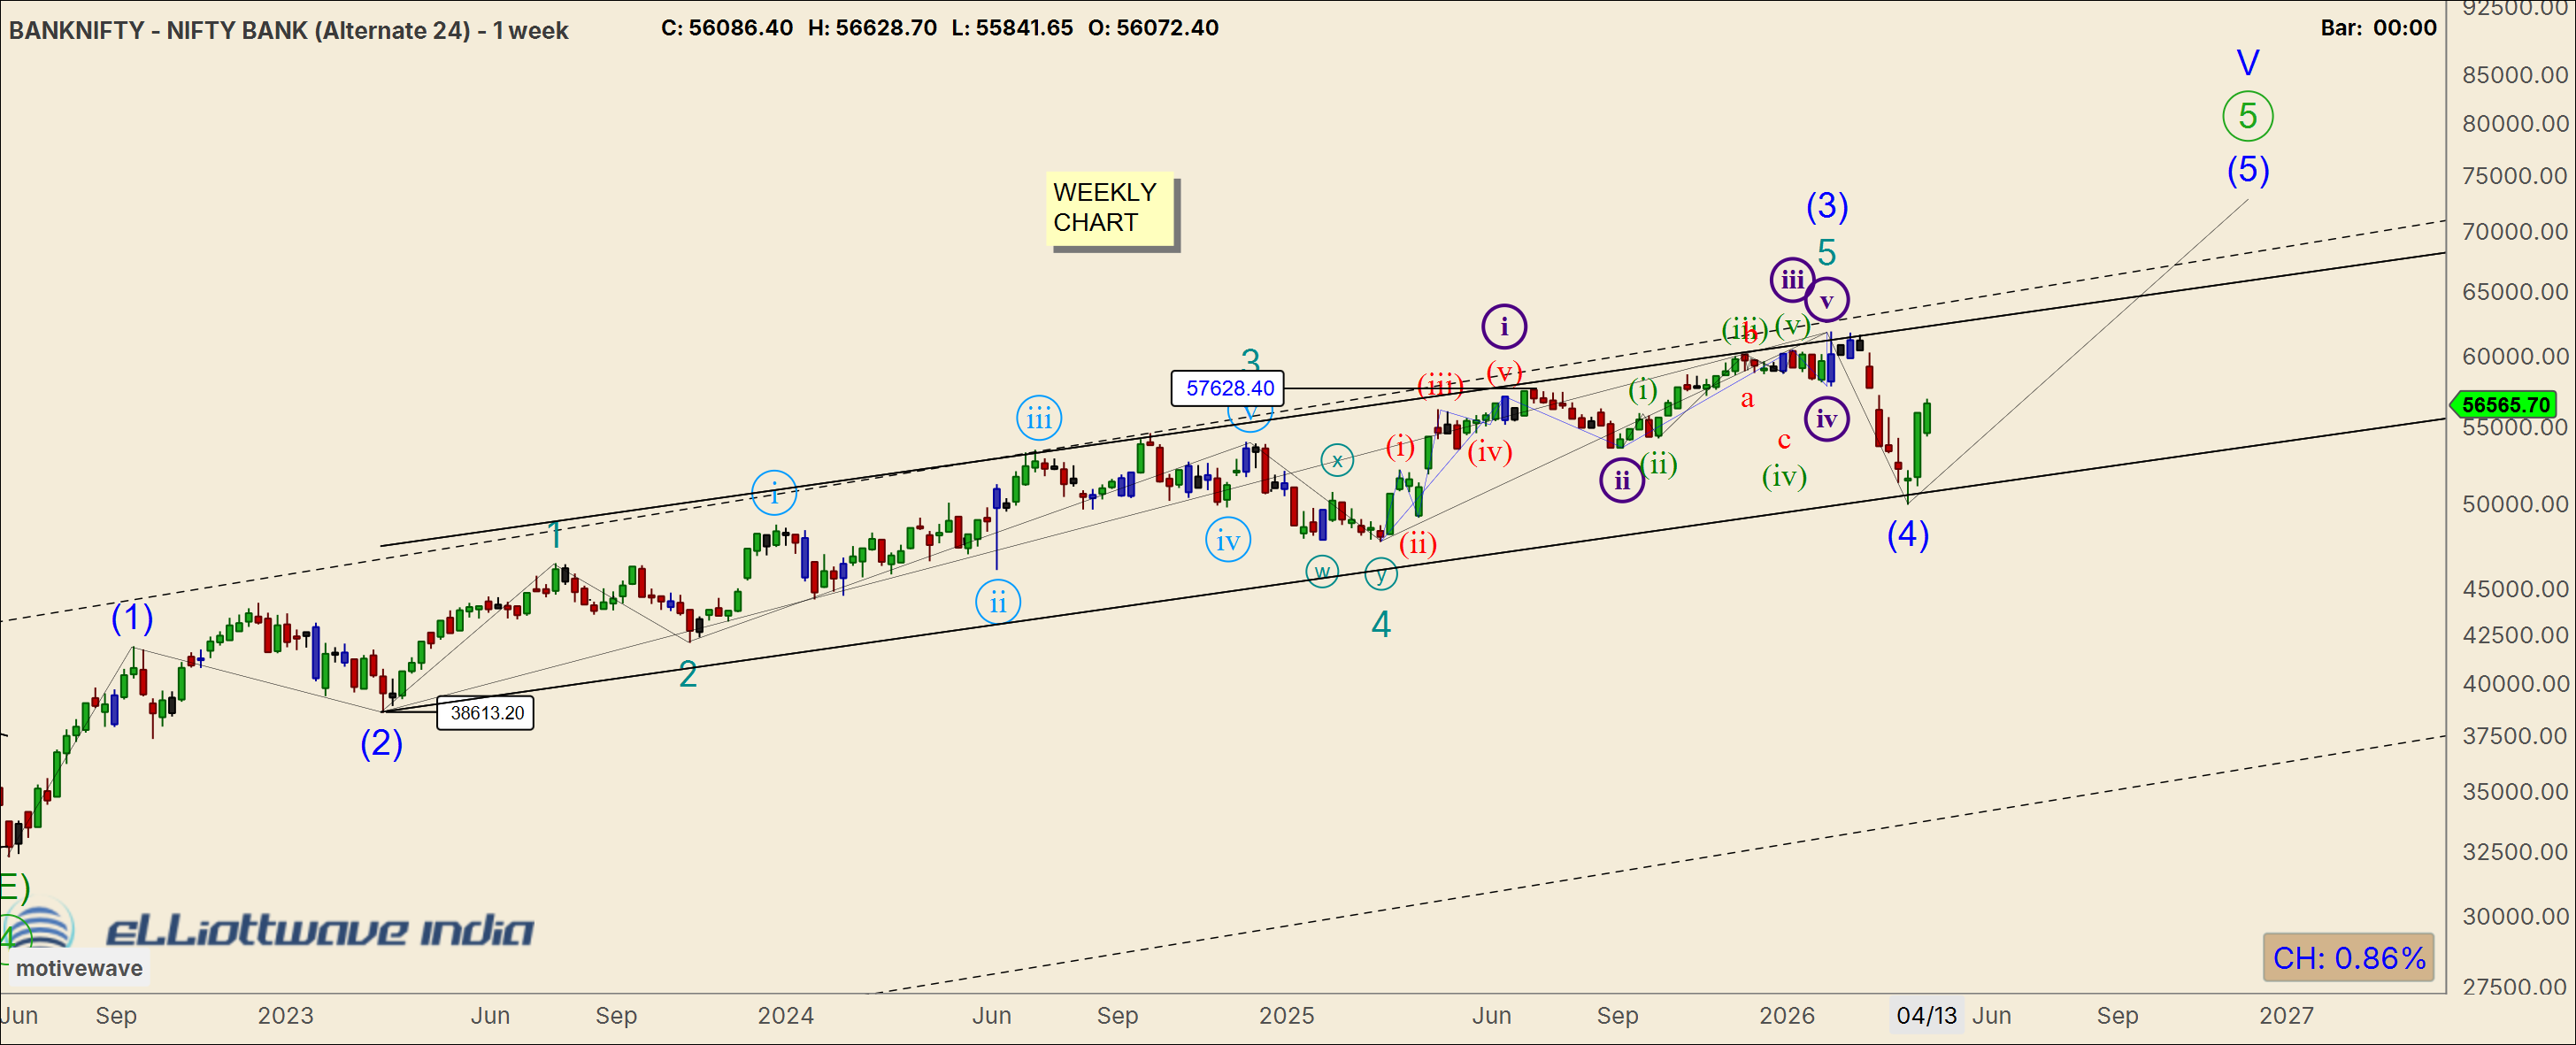
The internal subdivisions of Wave (3) are clearly visible, and the transition into Wave (4) followed by a reversal aligns well with channel support dynamics.
3-Day Chart
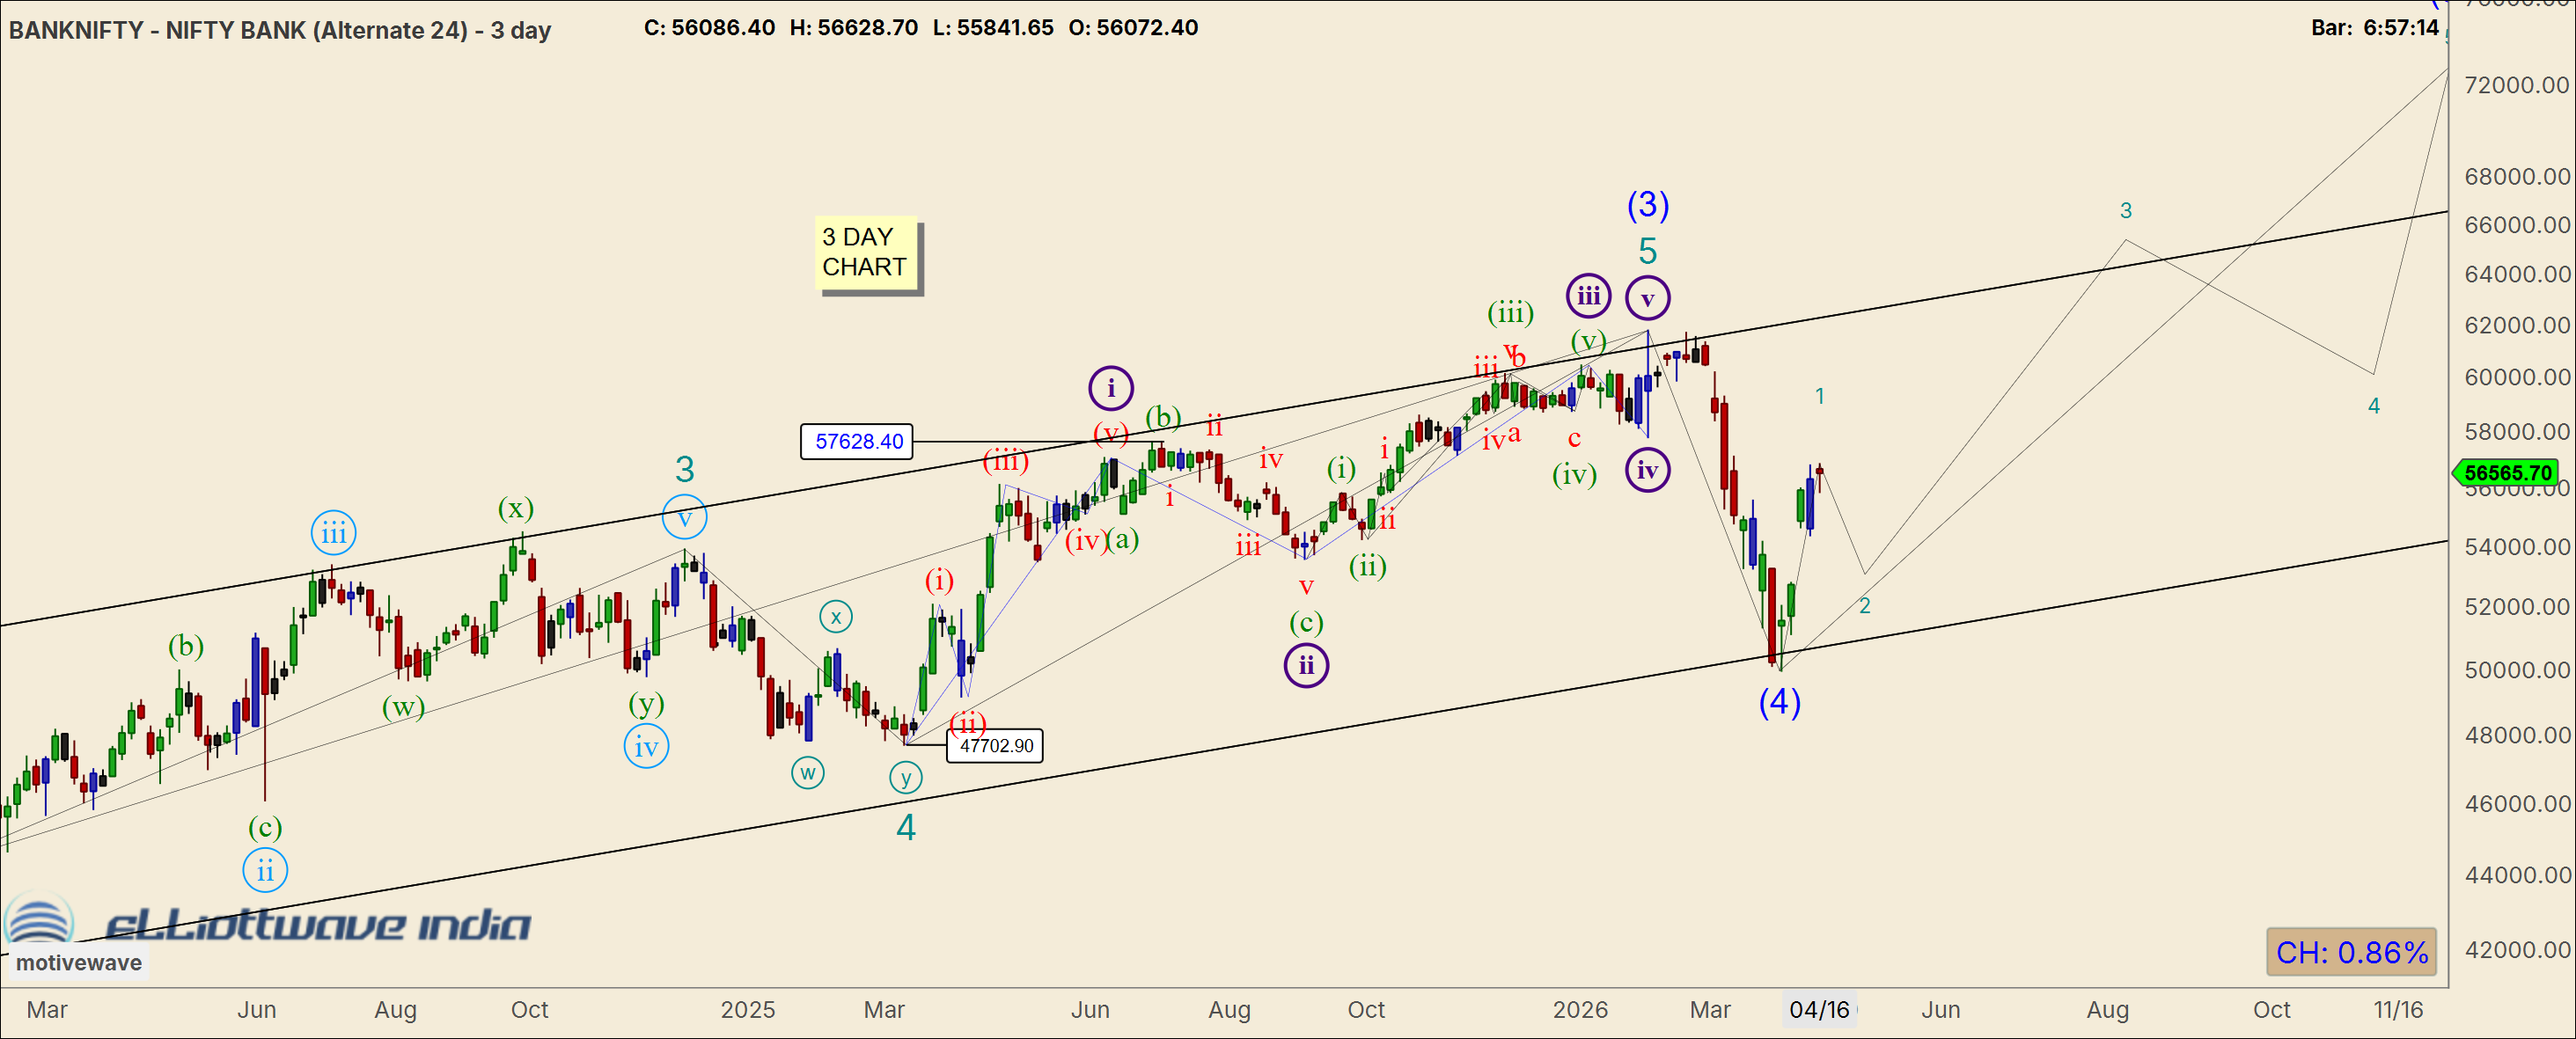
The market appears to have completed (or is close to completing) Wave 1 of the larger Wave 5.
This suggests near-term consolidation or pullback (Wave 2) before the next impulsive leg higher.
Daily Chart
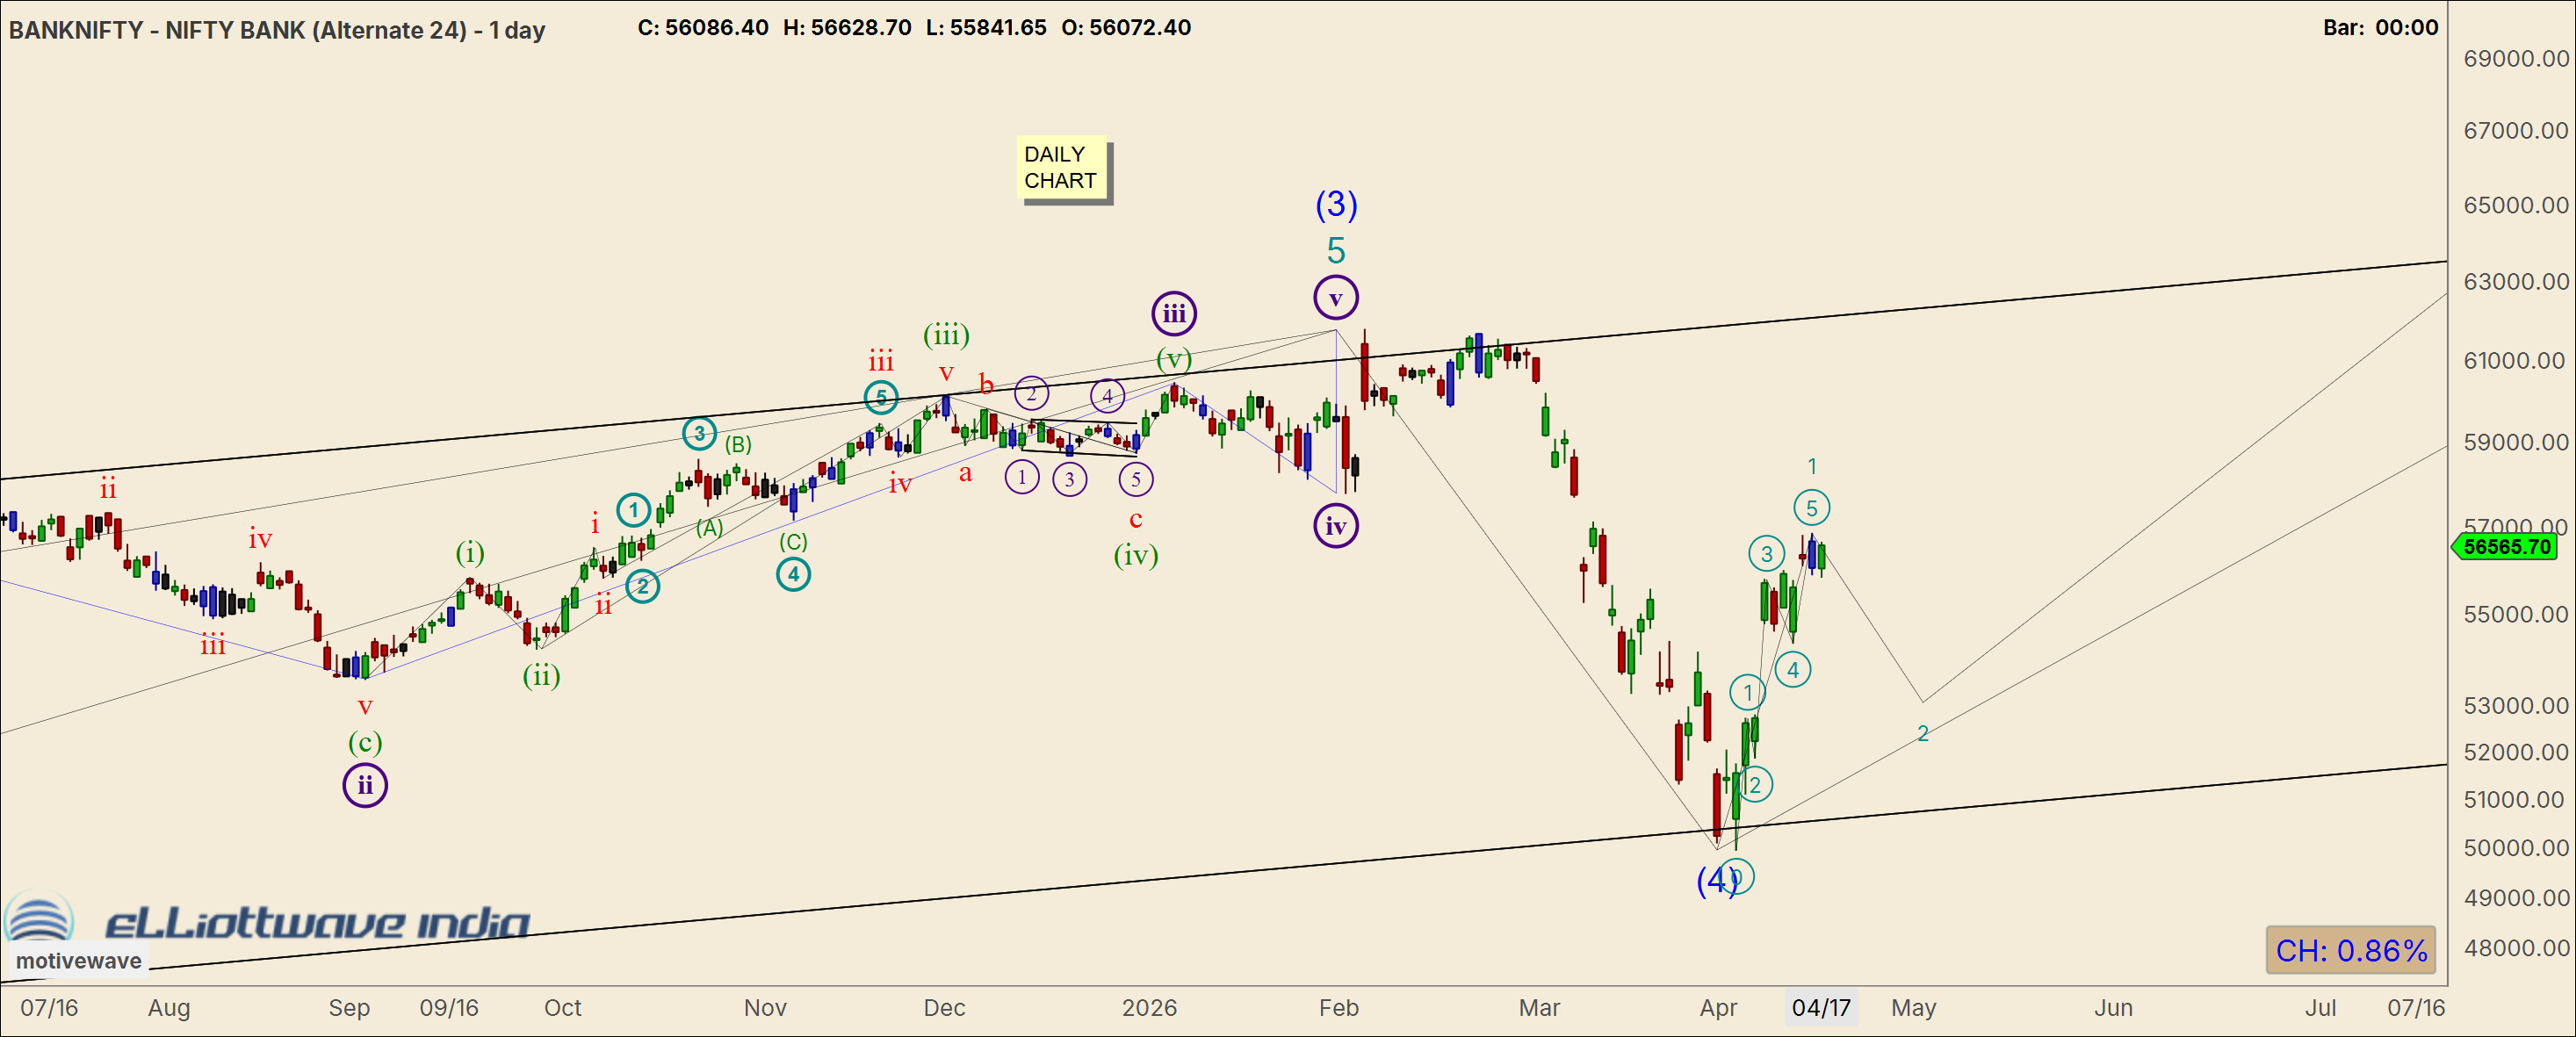
Subdivisions within Wave 1 are visible and consistent with an impulsive structure, supporting the bullish continuation thesis.
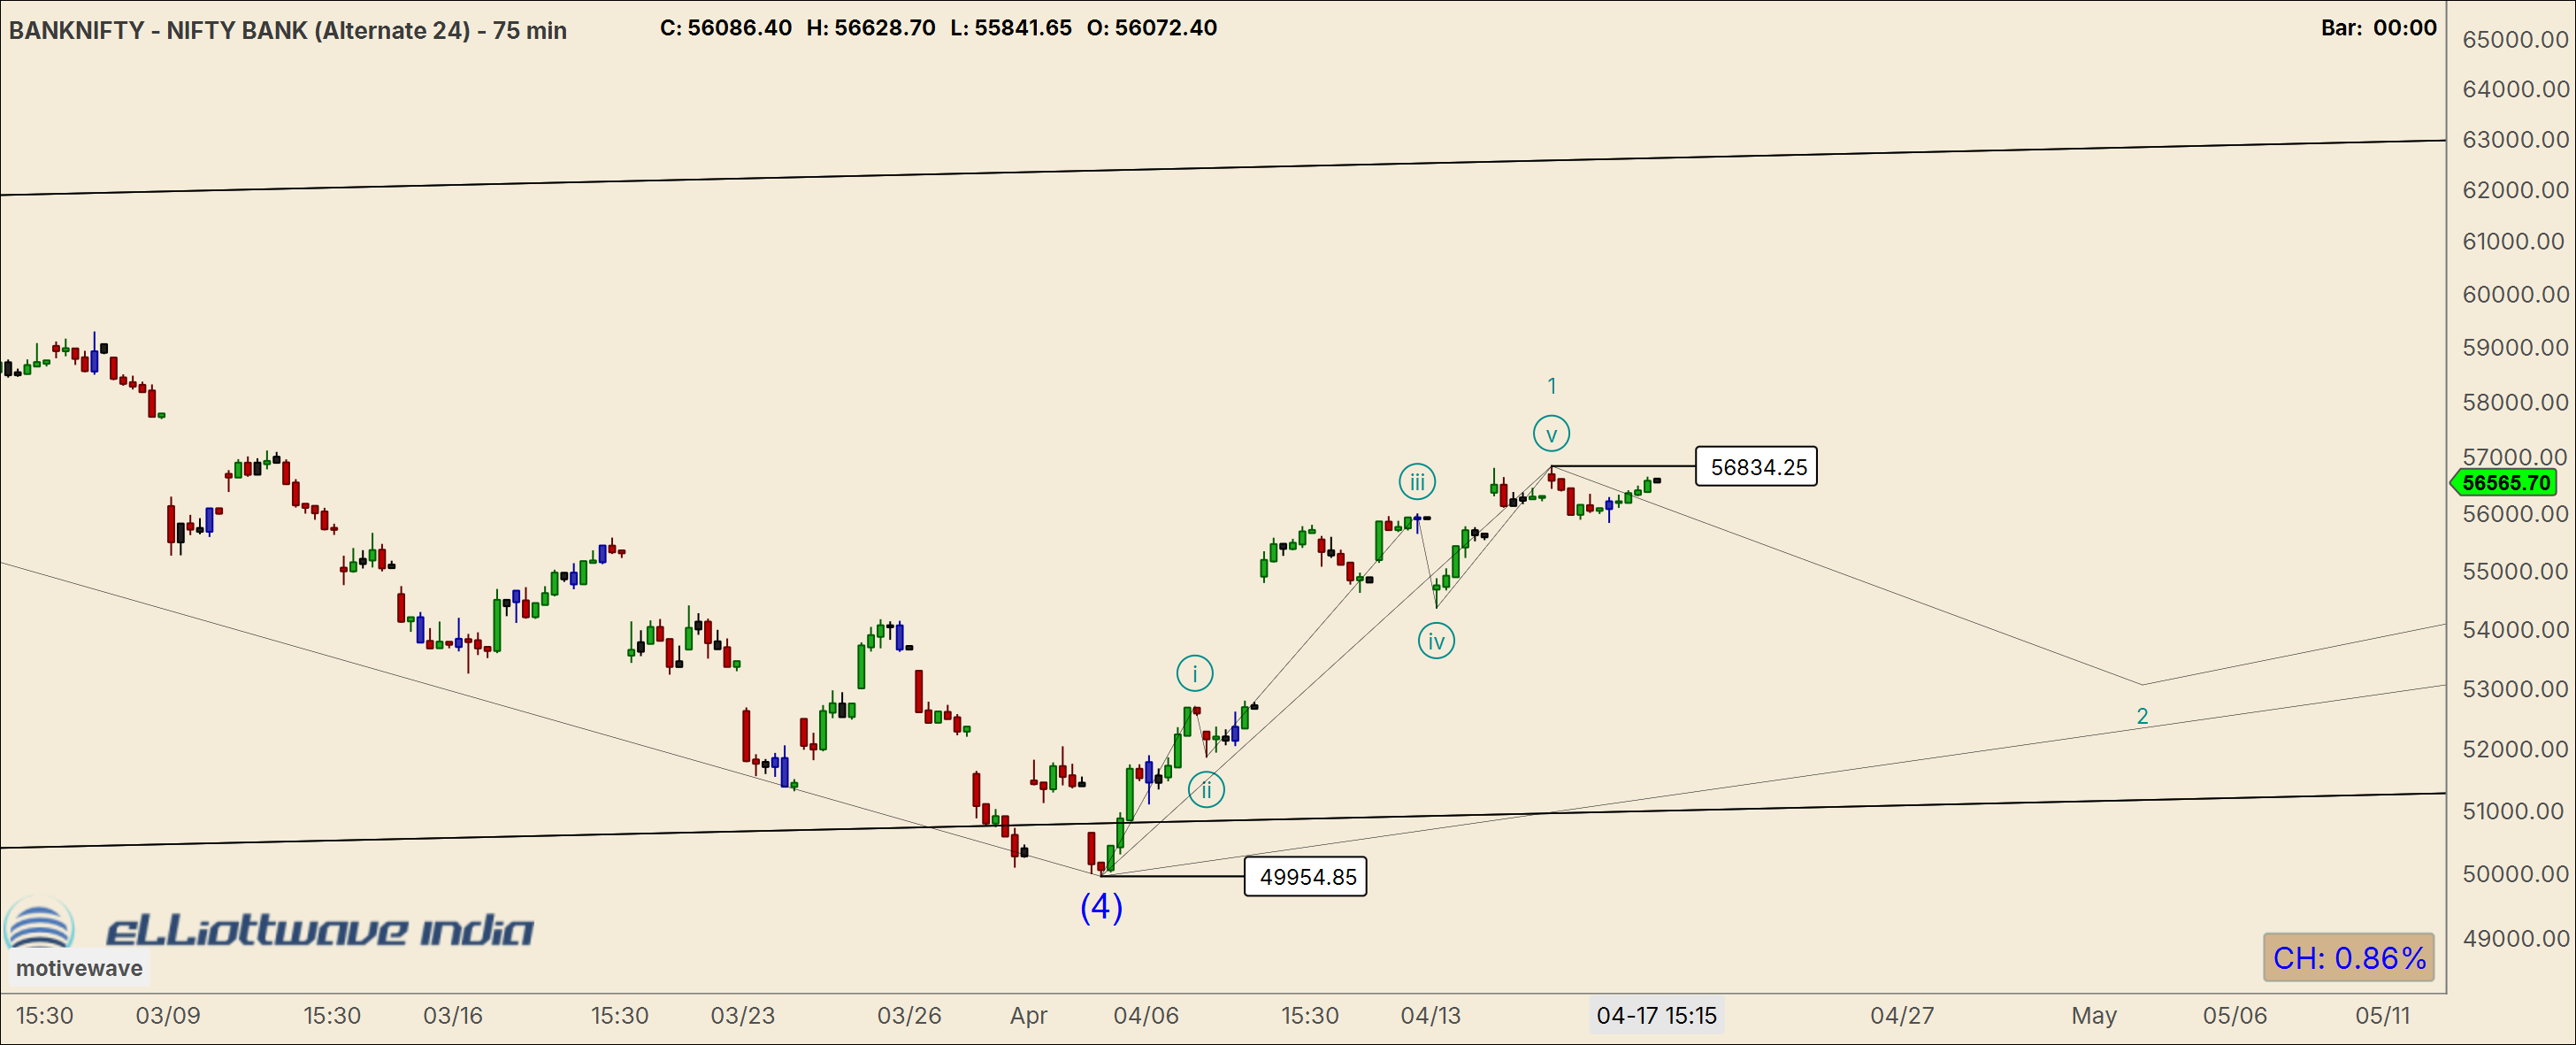
75-Min Chart
A clear 5-wave impulsive structure within Wave 1 can be observed, reinforcing that the move off 49,954 is not corrective, but directional.
--
Alternate Count
The alternate scenario does not negate bullishness, but changes the path and timing.
Instead of a direct impulsive rise, Bank Nifty may be entering a larger sideways Wave 4 structure (triangle or flat), which could extend over several months.
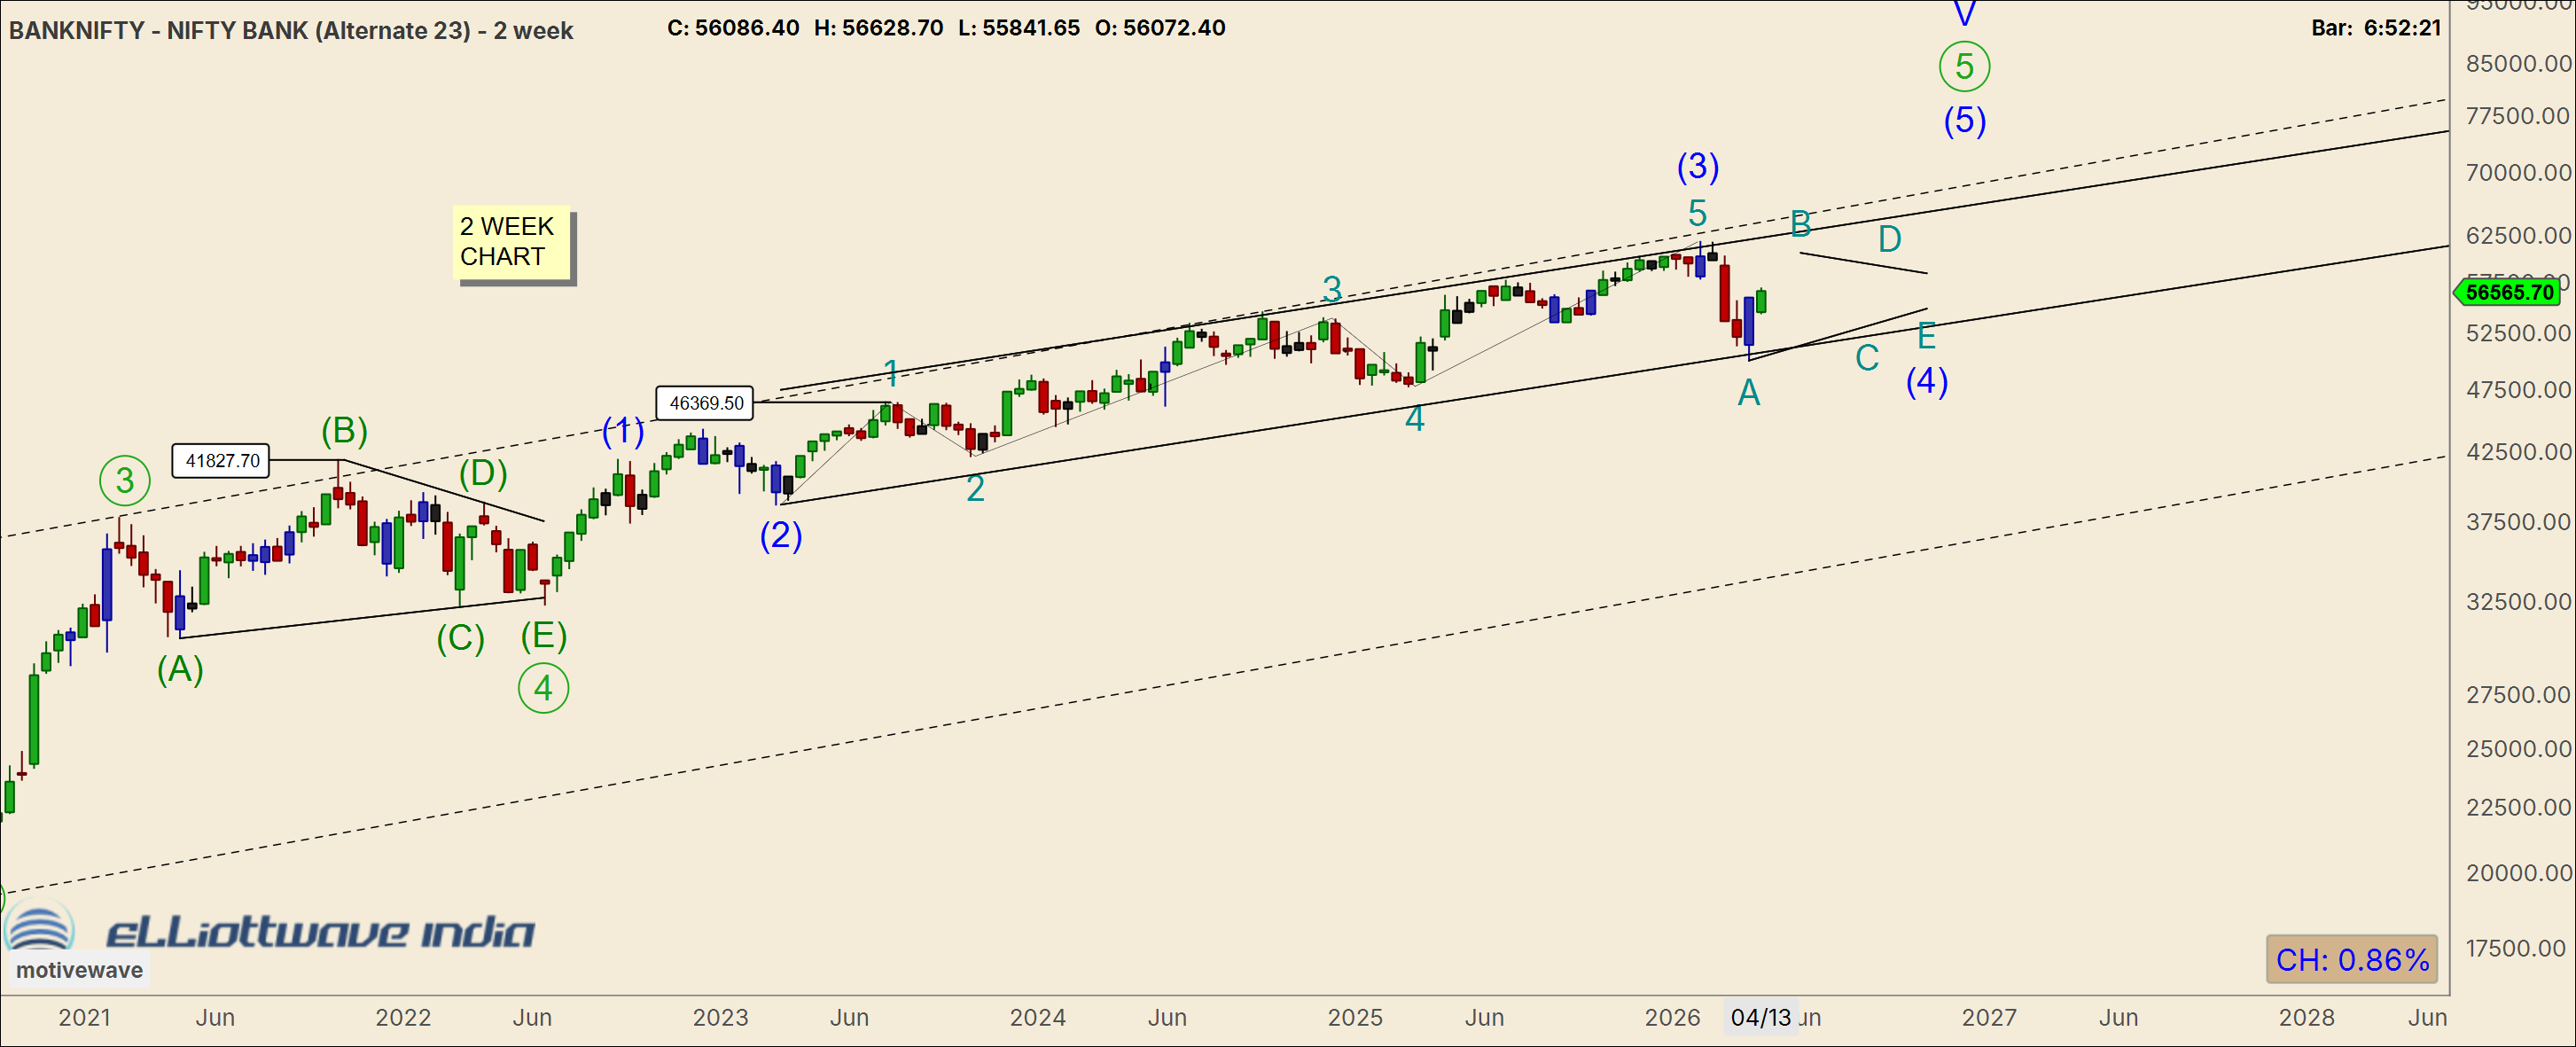
2-Week Alternate View
A triangle or complex flat remains possible, implying prolonged consolidation before the eventual breakout.
Structure Interpretation
- Wave A down likely completed at 49,954
- Current move higher is Wave B within the larger corrective structure
3-Day Alternate View
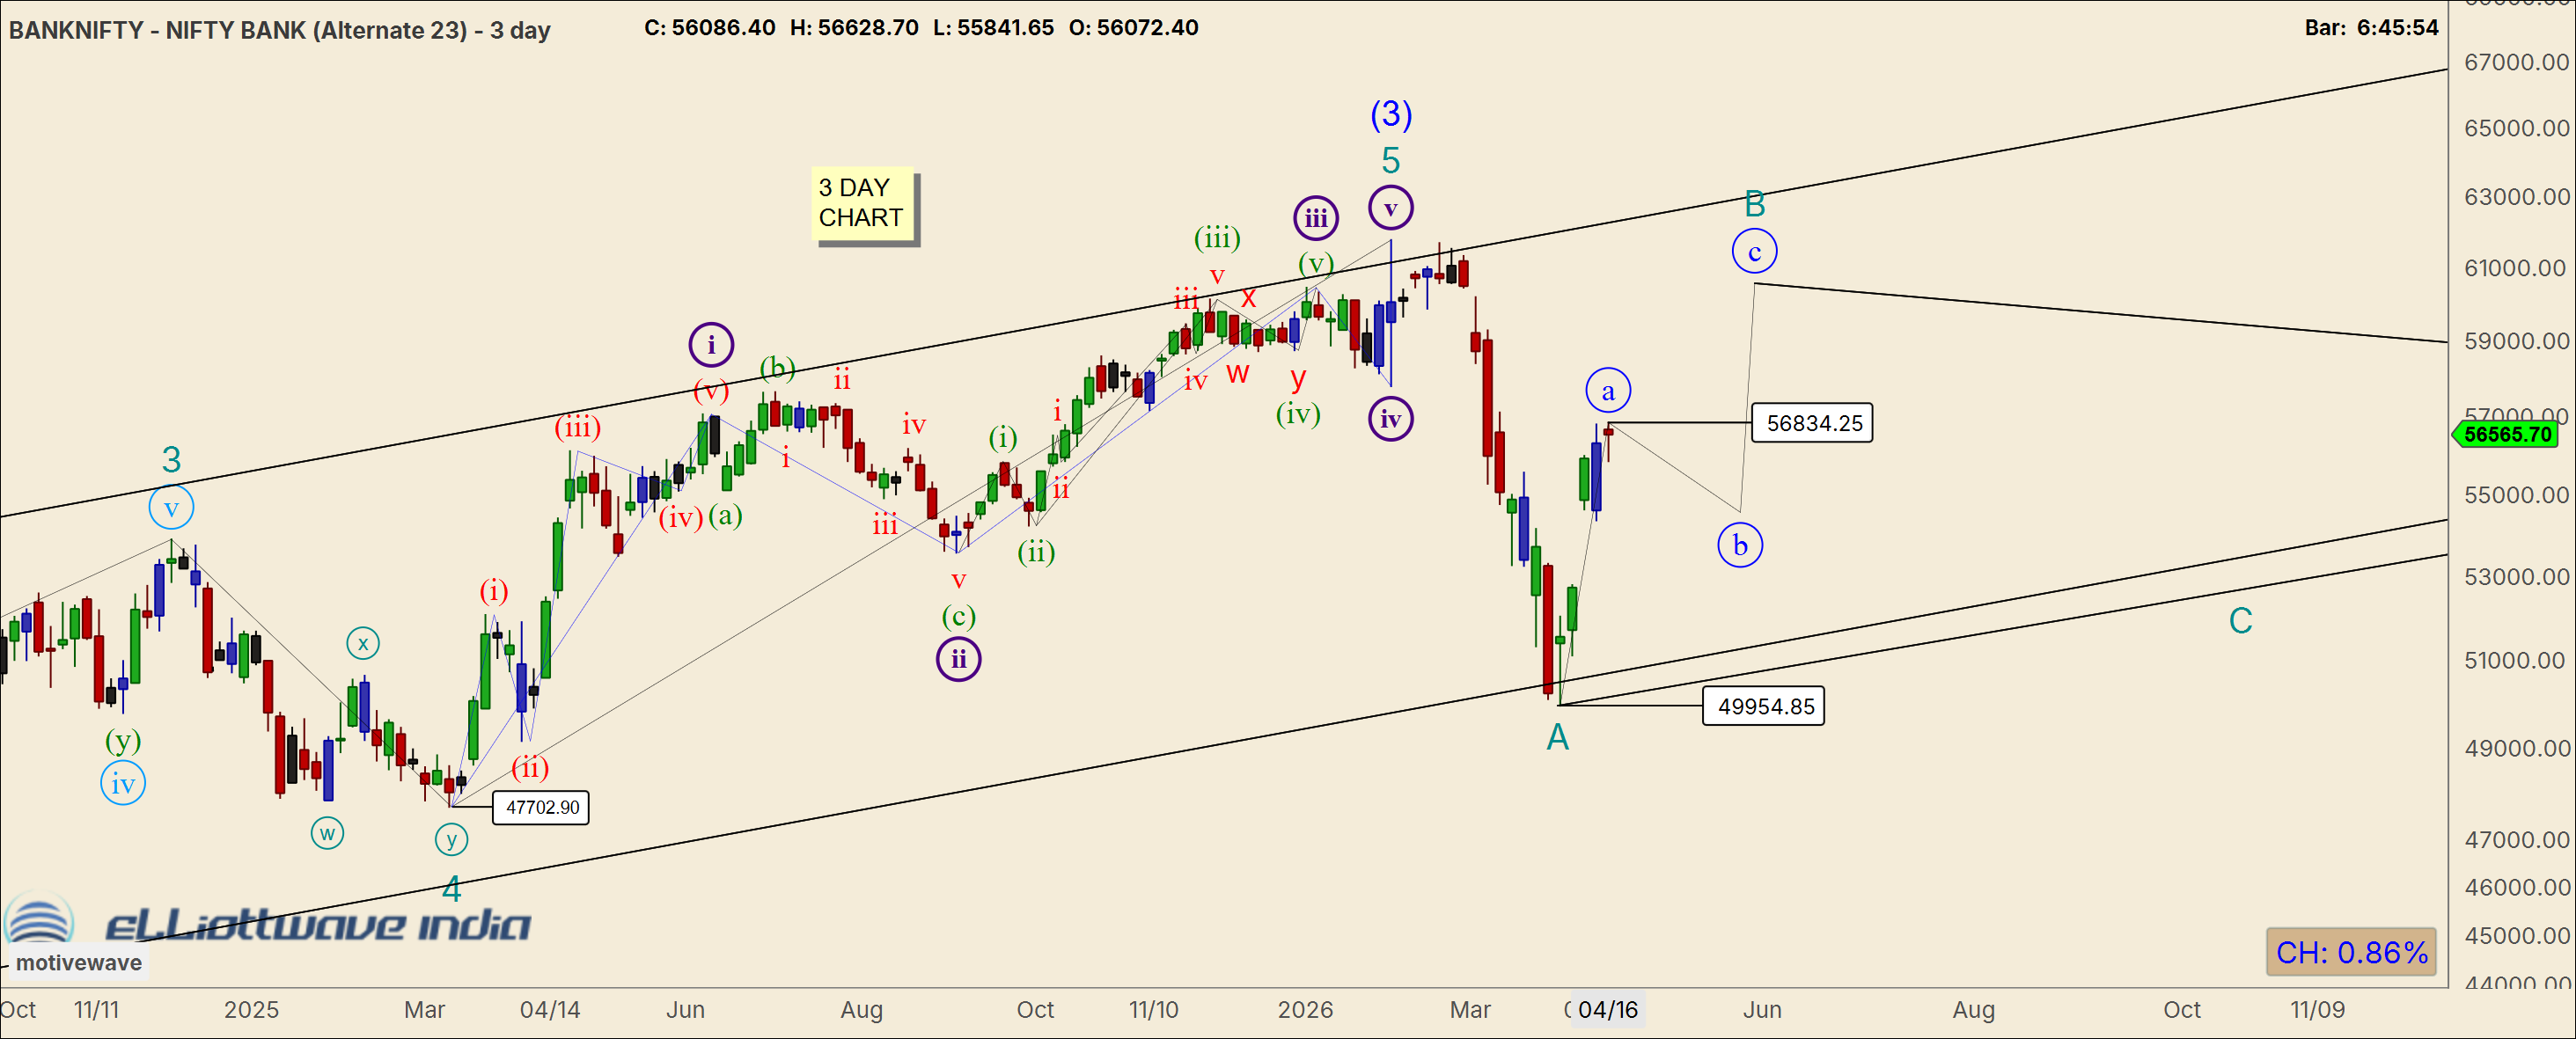
The current up-move may be part of a 3-wave corrective advance (Wave B), with a smaller degree Wave ‘a’ nearing completion.
What Matters Now (Practical Read)
- The move from 49,954 has impulsive characteristics → bullish bias remains intact
- However, short-term exhaustion in Wave 1 (75 min chart) suggests:
- Either Wave 2 pullback (buy dips scenario)
- Or sideways grind (time correction) before continuation