ADBE: The Trade of the Decade
The Bottom Is Close. The Bull Market Isn't
Published on 17 May 2026. This is a partially free post. For full access, click here.
Start at the beginning — 1986
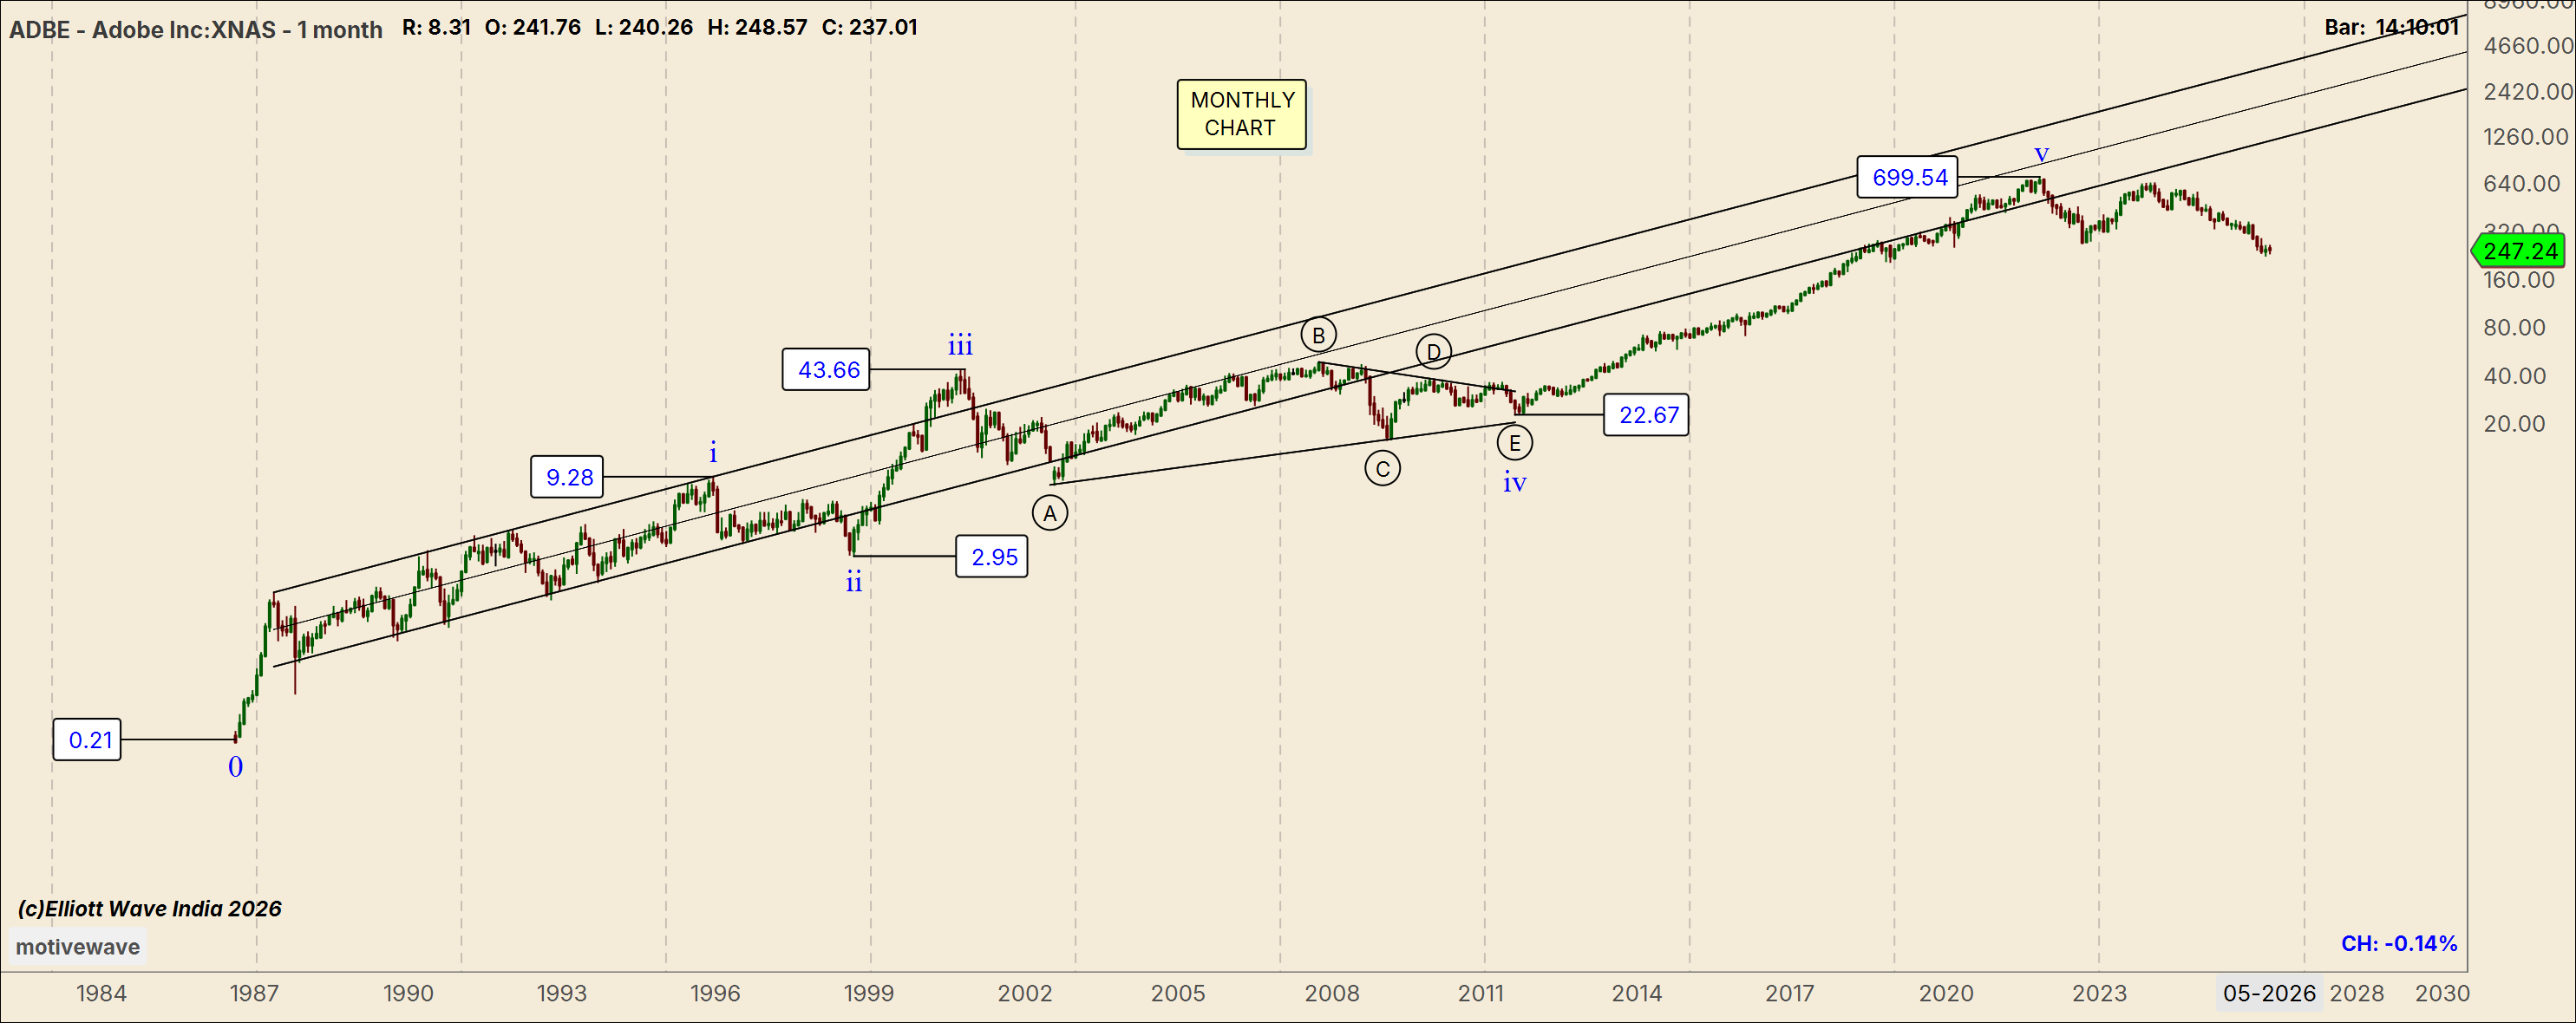
From its IPO in August 1986 at a split-adjusted $0.20, Adobe has traced one of the most extraordinary wave structures in US equity market history — a five-wave impulse inside a clean, rising log-scale parallel channel that has not been violated in four decades.
Wave i peaked at $9.28 (1995). Wave ii corrected to $2.95 (1998). Wave iii thrust to $43.66 (2000). Wave iv resolved as a multi-year triangle bottoming at $22.67 (2011). Wave v ran 123 monthly bars to the all-time high of $699.54 on November 22, 2021.
Twenty cents to seven hundred dollars. Thirty-five years.
The channel is the argument
In any impulse, a genuine third wave extension thrusts through the upper channel line. Price accelerates, volume surges, the ceiling breaks. That is the defining visual signature of an extended third.
Here, twenty years of price action rides inside and below that line without a single convincing breach. This is fifth wave behaviour. And a completed extended fifth wave at this degree has specific corrective implications — implications the sub-wave structure now confirms with uncomfortable precision.