Elliott Wave Tells You What. Gann Tells You When. What next for Uber?
When Price and Time Agree
A top-down Elliott Wave read on Uber — and why the correction low at $68.46 was less a surprise than a mathematical inevitability.
Start at the beginning
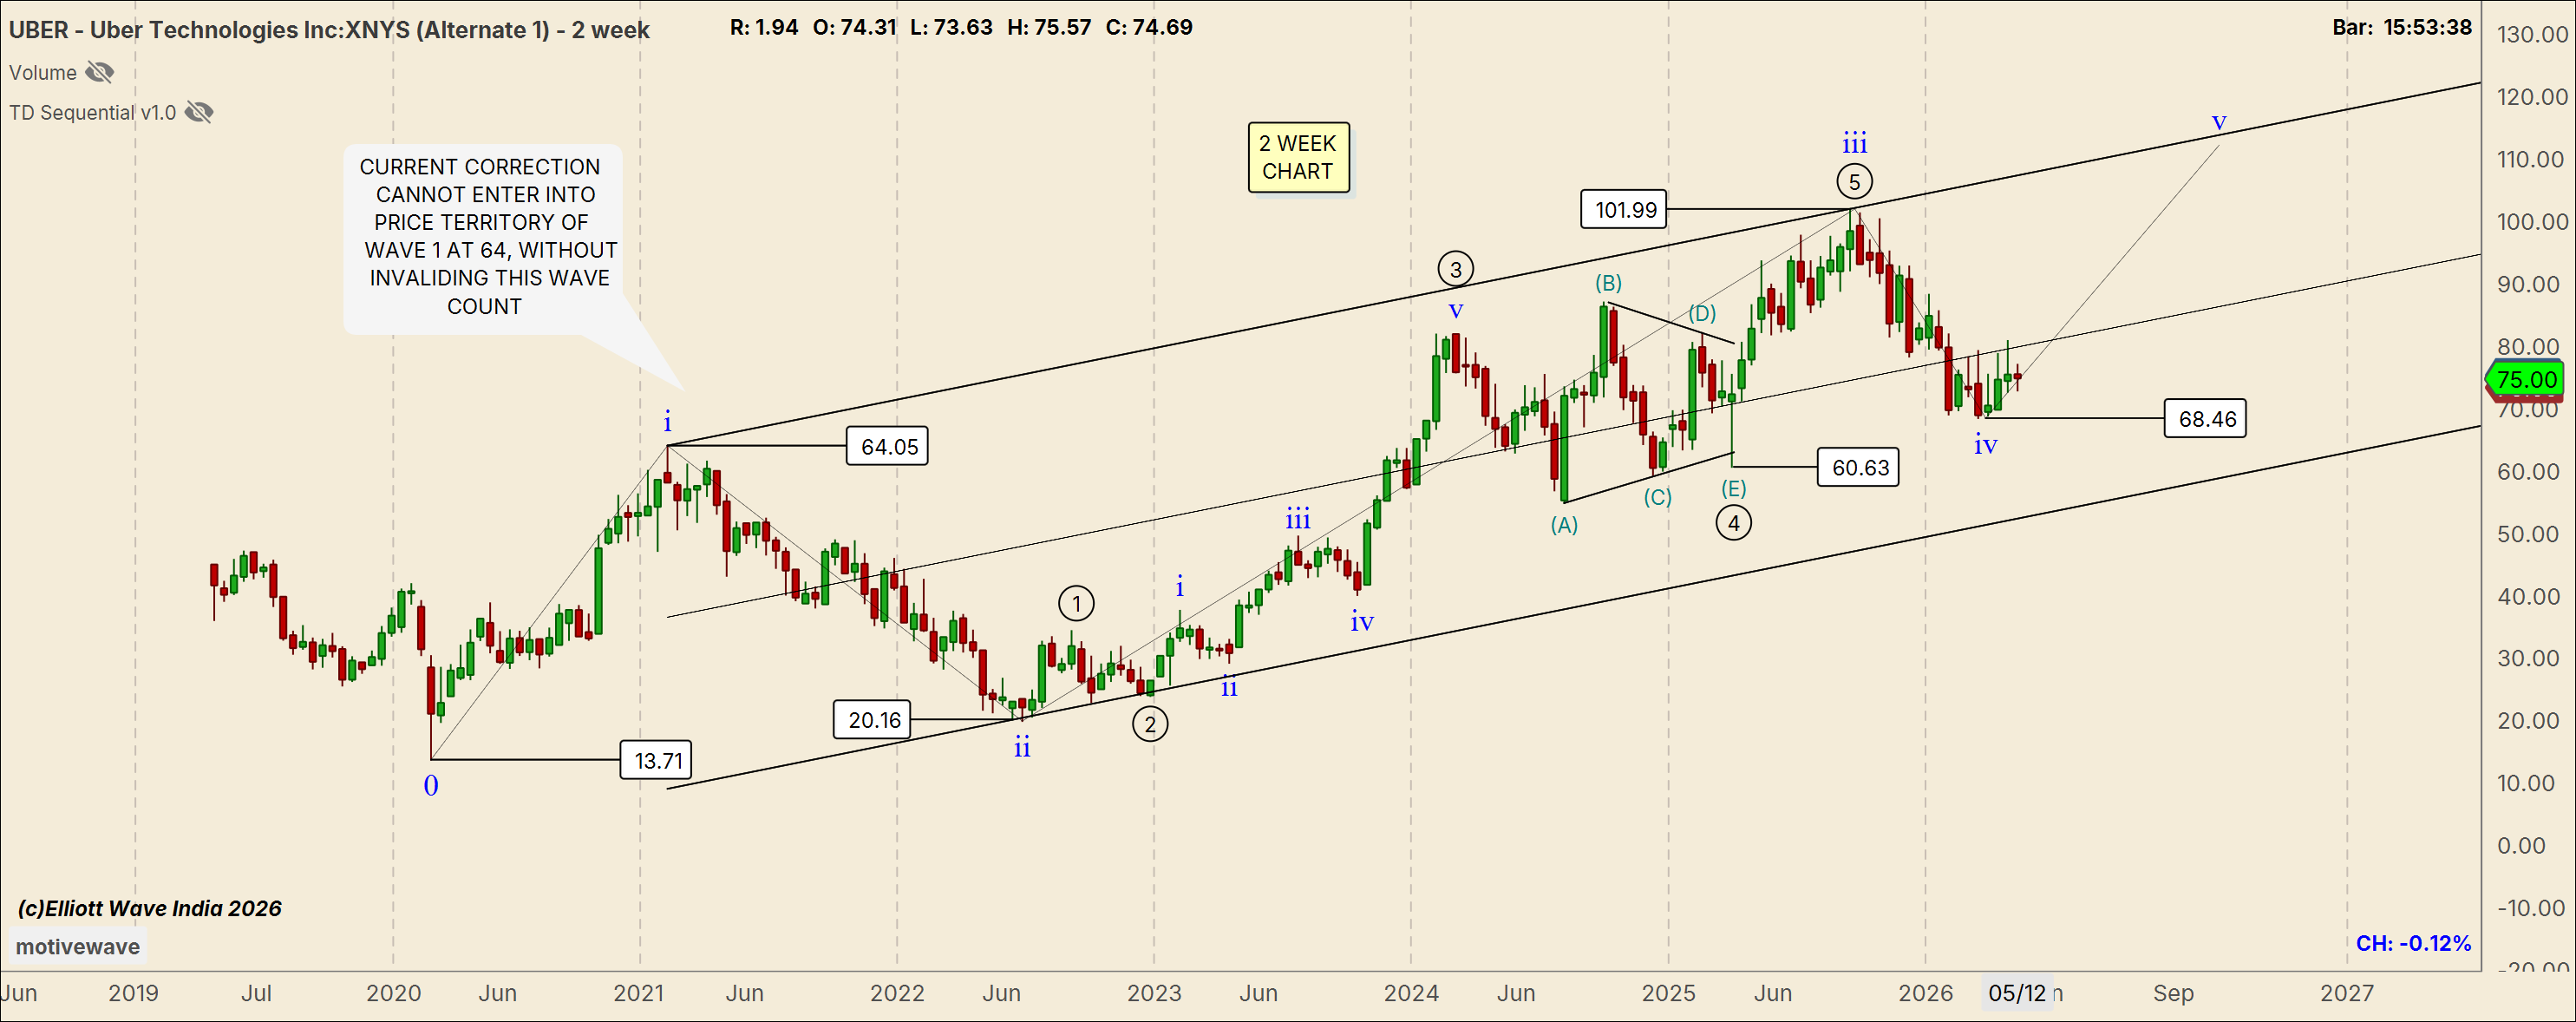
The 2-week chart is where conviction lives. From Uber's IPO-era low of $13.71 in March 2020, price has traced a five-wave impulse inside a clean rising parallel channel. Wave (1) peaked at $64.05. Wave (2) retested $20.16. The third wave — the longest and most forceful, as it should be — extended to the all-time high of $101.99 reached on September 22, 2025.
The current decline from that high is Wave iv of the larger impulse. One rule governs everything below it: Wave iv cannot enter the price territory of Wave i at $64.05. That number is your structural line. Everything else is interpretation. That level is law.
The triangle and the guideline it satisfies
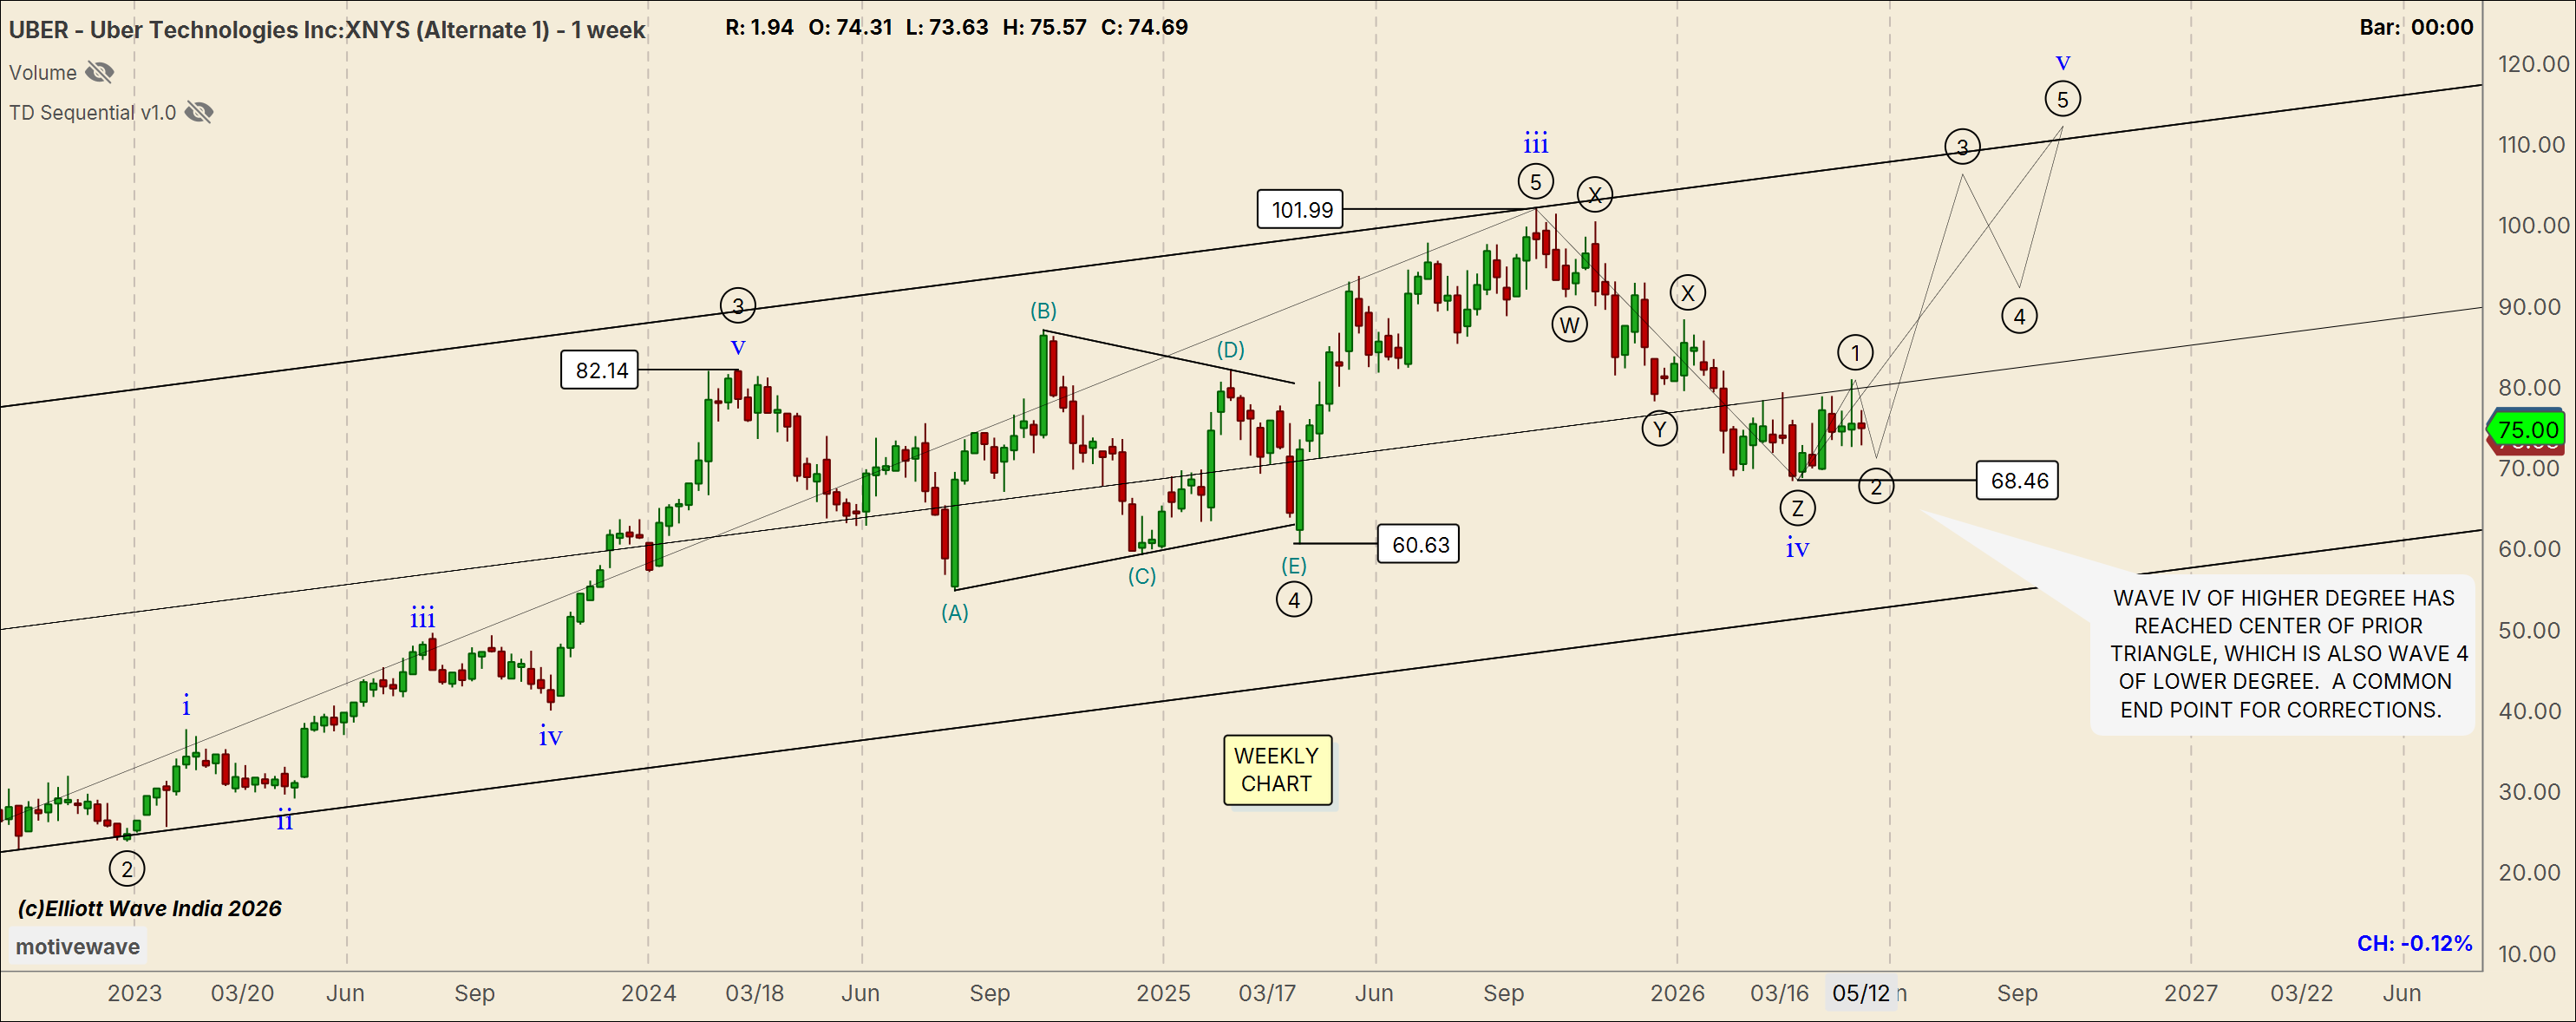
The weekly chart fills in the corrective structure. The move from the $101.99 high resolves as a five-legged contracting triangle — (A)-(B)-(C)-(D)-(E) — with the (E) leg terminating at $60.63 on April 7, 2025. Triangles in Wave 4 position resolve in the direction of the prior trend. They compress time and price before the final extension. The (E) leg at $60.63 is the reference point for the entire bullish thesis going forward.
From there, price launched into what we are labelling as the early stages of Wave v of the larger degree. The weekly chart shows clearly that price has not broken the lower rail of the long-term channel — structurally, there is no damage to the bull case.
The guideline that doesn't get talked about enough
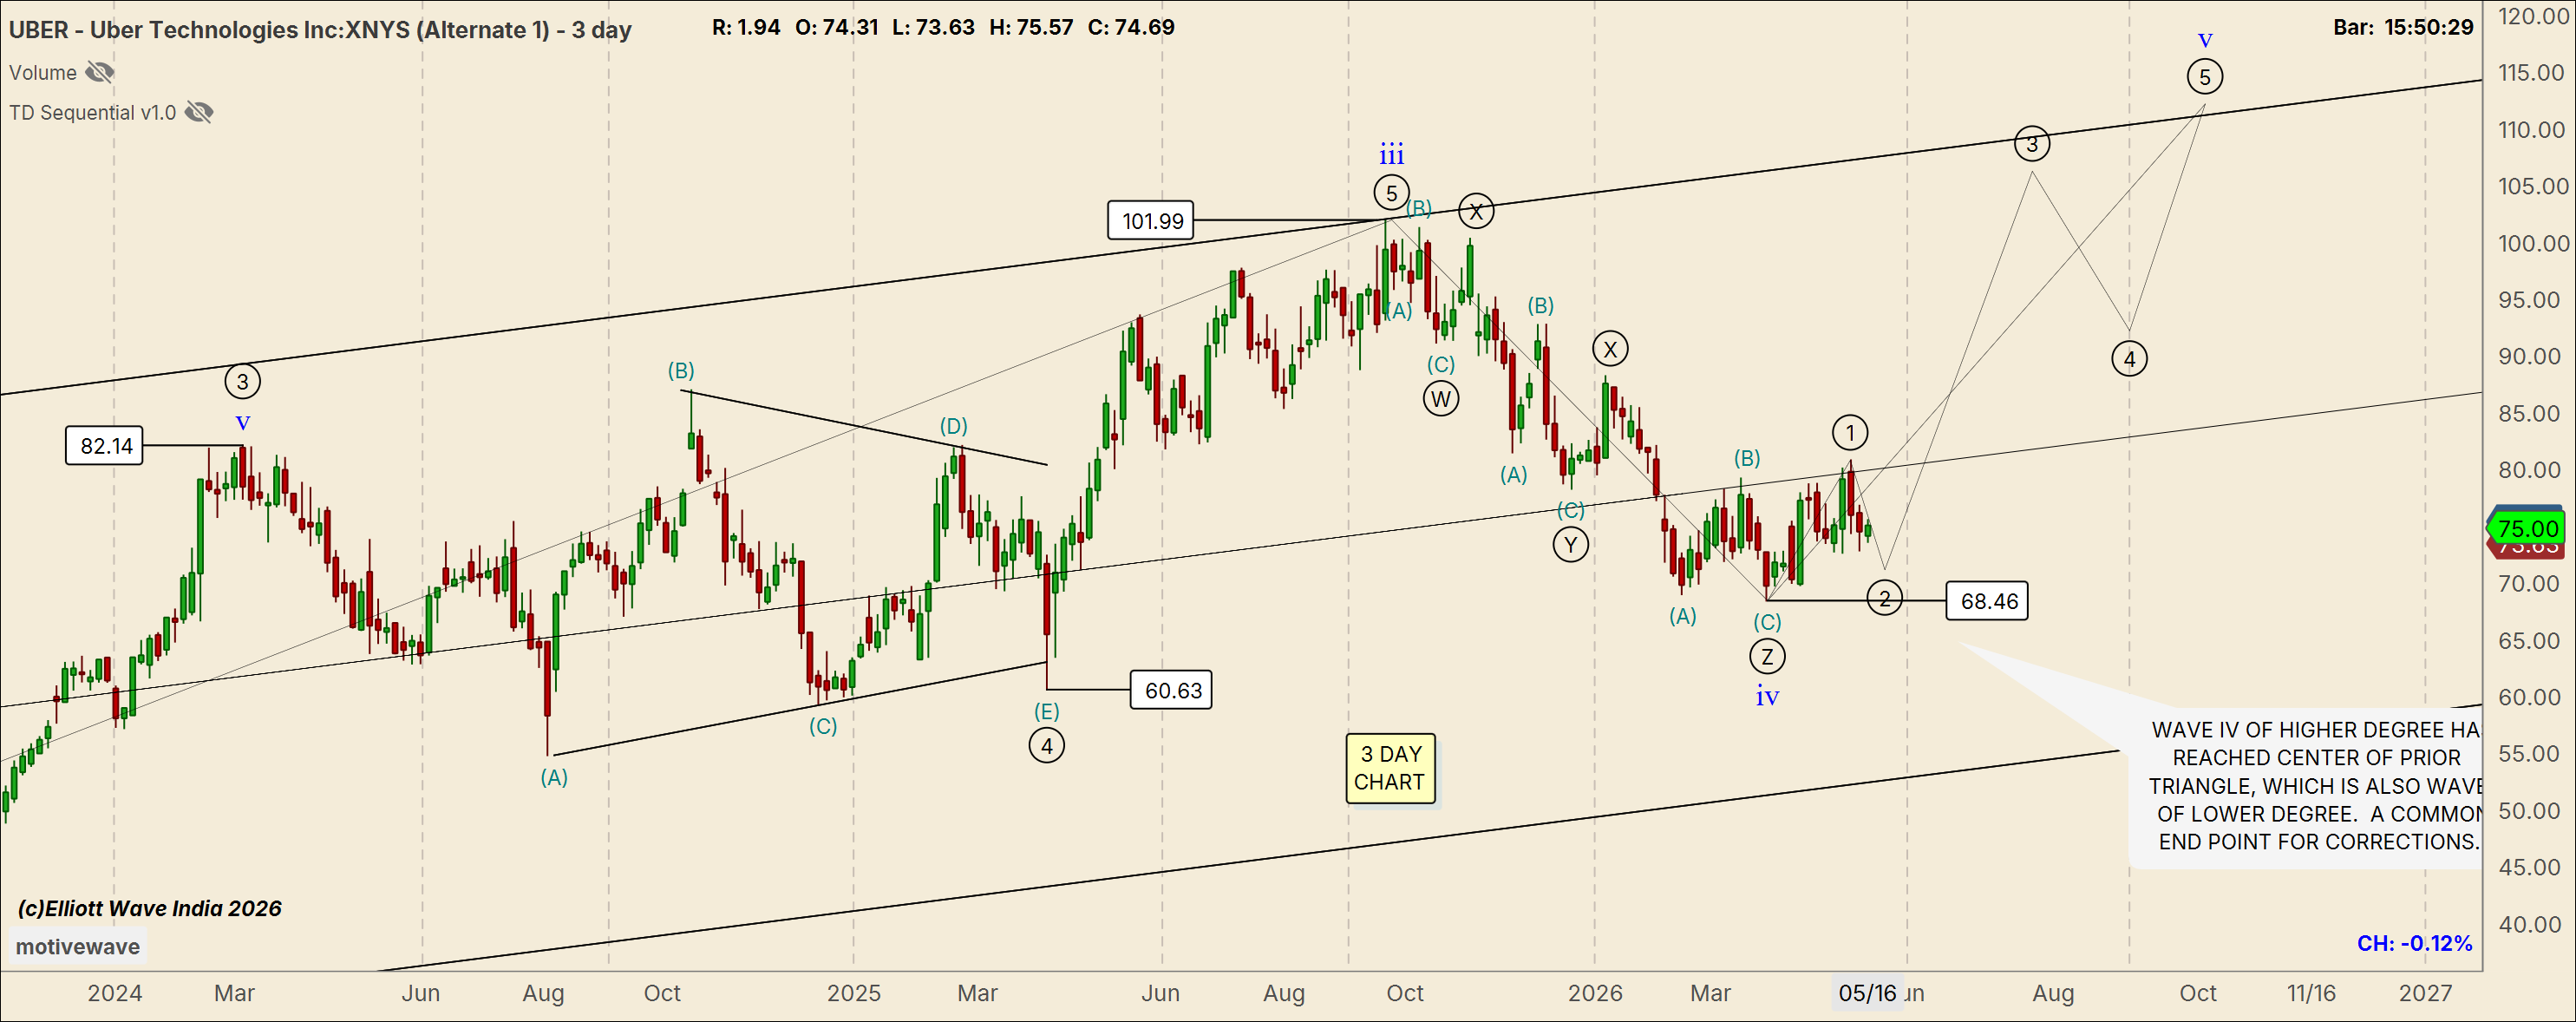
The 3-day chart carries an annotation worth reading carefully: Wave IV of higher degree has reached the centre of the prior triangle, which is also Wave 4 of lower degree — a common end point for corrections.
This is one of Elliott's most reliable guidelines and one of the least-cited. Corrections in Wave 4 position frequently terminate at the price territory of the fourth wave of one lower degree, and often at the geometric mid-point of the prior consolidation. Here both conditions are satisfied simultaneously. That is not a quirk of the count — it is the structure doing exactly what the theory predicts.
An honest note on the leading diagonal
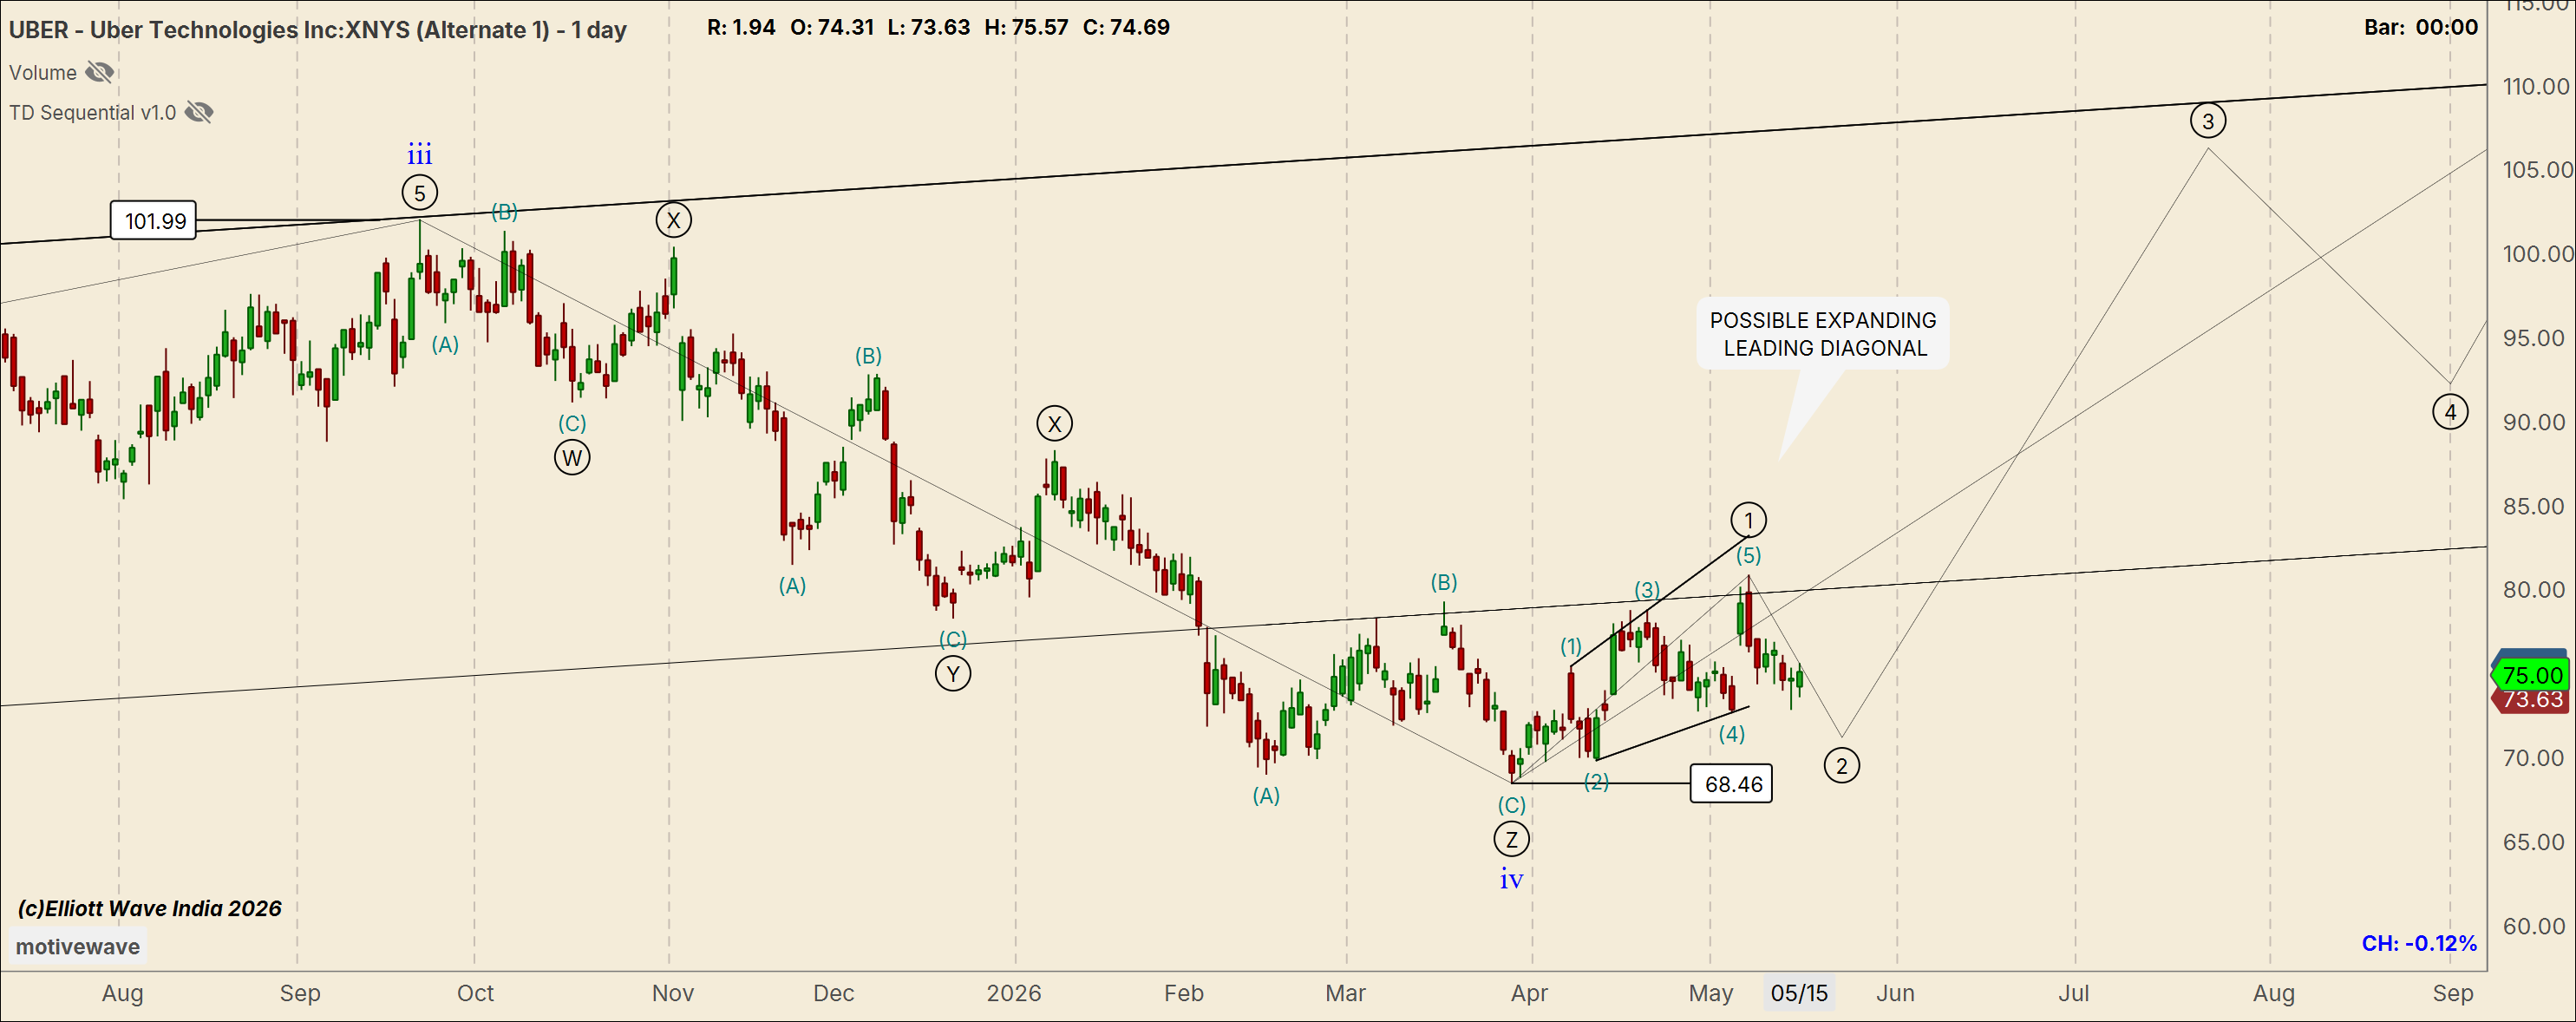
The daily chart shows the advance from the $68.46 low taking the shape of an expanding leading diagonal — five waves within diverging trendlines, each subdivision larger than the last. This structure, if the label holds, marks the opening move of Wave (1) of the new advance, which peaked near $84 before pulling back in the current Wave (2) retracement.
A direct word on this label: expanding leading diagonals are exceedingly rare. They exist in the Elliott literature, but many experienced practitioners decline to use them at all. The honest read is that the internal structure from $68.46 may yet prove to be a continuation of the larger corrective sequence — meaning new lows below $68.46, and potentially a test of $64.05, cannot be ruled out on the daily timeframe alone.
The higher-timeframe structure argues strongly against that scenario. But the daily label is the weakest link in this analysis, and you should treat it as such.
Key levels
| Level | Price |
|---|---|
| Current price | $74.69 |
| Wave (2) low — key support | $68.46 |
| Wave i — invalidation | $64.05 |
| Triangle (E) — structural floor | $60.63 |
| Wave (3) target | $95–105 |
| Wave (5) / upper channel | $115–121 |
Why the market didn't just happen to stop at $68.46
Elliott Wave tells you what the structure is. What it doesn't tell you is why certain price levels consistently attract reversals, or why markets so often turn at specific points in time rather than others.
For that, we turn to W.D. Gann — not as a mystical supplement to wave analysis, but as a separate geometric and mathematical framework that either confirms or challenges what the wave count is saying.
What follows is what that framework says about Uber. Five independent Gann tools were applied. They did not know about each other. They did not know about the Elliott count. And yet they converged — on price, and then, more remarkably, on time.
All of that is below.
Five tools, one level
Finding 01 — Fibonacci
Finding 02 — Gann Hexagon Chart
Finding 03 — Natural Squares
Finding 04 — Square of 9
Finding 05 — Gann natural fractions
This is where it gets unusual
Price confluence is one thing. Time confluence is another. The following findings are based entirely on confirmed dates — verified across TradingView, FinanceCharts, and MotiveWave. No estimates. No approximations.
Four anchor dates govern the model:
| Swing | Price | Date |
|---|---|---|
| IPO-era low | $13.71 | Mar 18, 2020 |
| Triangle (E) low | $60.63 | Apr 07, 2025 |
| All-time high | $101.99 | Sep 22, 2025 |
| Wave (2) low | $68.46 | Mar 27, 2026 |
Time finding 01
Time finding 02
Time finding 03
Time finding 04 — retroactive validation
Sep 11–22, 2026 — six clocks, one window
Six independent Gann time methods, applied separately, all project a significant market event in a single 18-day window in September 2026. The tightest cluster is just six days wide.
| Date | Basis |
|---|---|
| Sep 11, 2026 | Wave (2) low + 168 days — mirror of tri→ATH rally |
| Sep 17, 2026 | ATH + 360 days — annual Gann cycle |
| Sep 22, 2026 | Autumn equinox — Gann's master seasonal date |
| Sep 22, 2026 | 1-year anniversary of the ATH |
| Sep 23, 2026 | Wave (2) low + 180 days — half-year harmonic |
| Sep 29, 2026 | Triangle low + 540 days — 1.5-year cycle |
The EW price model projects the Wave (3) target at $95–105. The Gann time model projects a significant peak window at Sep 11–22, 2026. These two frameworks — one built on market structure, one built on price geometry and time — arrived at the same destination independently.
This is not how you use Gann to confirm what you already believe. This is how you use two separate analytical systems to triangulate a target that neither could reach alone.
Complete forward time map
| Date | Implication |
|---|---|
| ~Apr 30, 2026 | Sub-wave (1) of Wave (3) boundary |
| ~Jun 03, 2026 | Sub-wave consolidation — Price=Time |
| Jun 25, 2026 | 90-day cycle from Wave (2) low |
| Sep 11–22, 2026 | Wave (3) peak window — primary target |
| ~Mar 22, 2027 | Wave (4) low window — spring equinox repeat |
| Apr 07, 2027 | 2-year anniversary of triangle low |
| Sep 18, 2027 | Wave (5) completion window — $115–121 |
Verdict
The structure is intact. The correction low is confirmed by five independent price tools. The high arrived on the autumn equinox. The lows arrived in the post-spring-equinox window — twice, in consecutive years. And six separate time counts converge on the same 18-day window in September 2026 as the projected Wave (3) peak.
The market does not move in price alone. It moves in price and time simultaneously. When both point to the same place, that is not coincidence. That is structure.
Invalidation
A daily close below $68.46 invalidates the leading diagonal and opens $64.05. A weekly close below $64.05 invalidates the five-wave advance from the IPO low entirely. Below $60.63, the triangle structure itself is gone. None of these are the base case. All of them must be respected.
Elliott Wave India · elliottwaveindia.com For educational purposes only. Not investment advice. Past wave structures do not guarantee future price behaviour. Trading involves significant risk of loss. The author does not hold a SEBI Research Analyst registration.