Nifty : When Structure Leads, Price follows (Public)
This is a free-access update shared for reference.
Subscriber updates provide more detailed structure and ongoing coverage.
Nifty — Short-Term Follow-Up
As on 1 May 2026
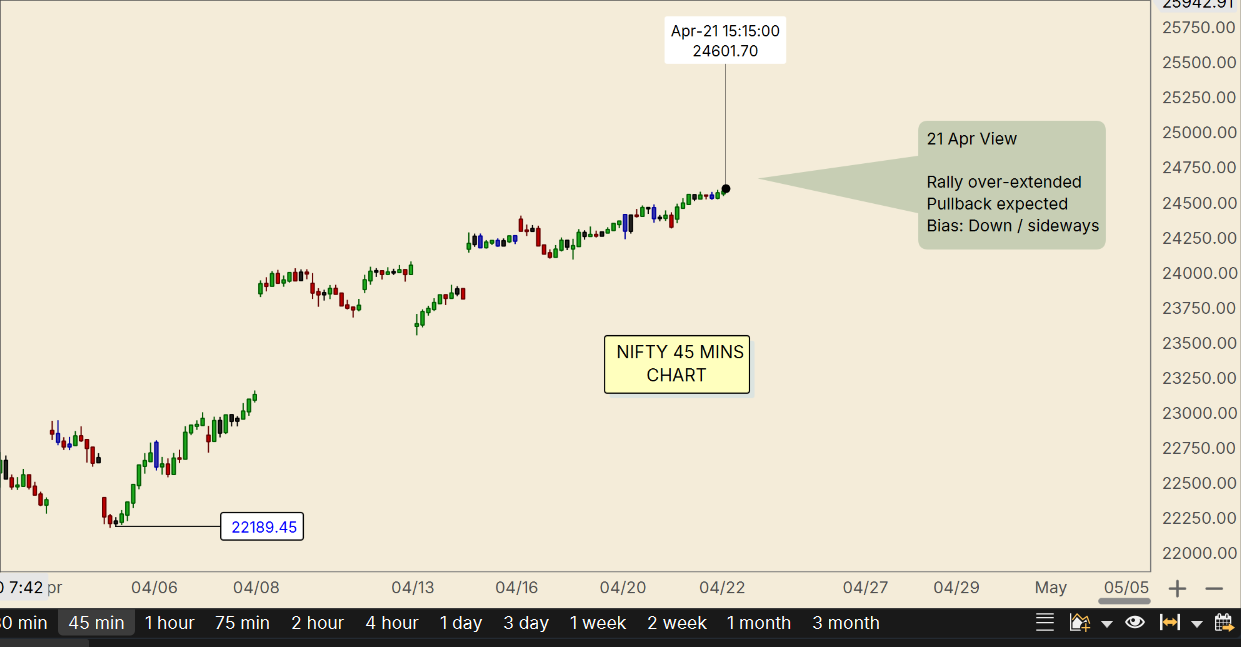
Context (View on 21 April 2026)
On 21st April, the rally in Nifty from 22,189 to 24,601 was assessed as over-extended, with a corrective phase expected.
This view was based on a clear time–price imbalance, rather than short-term momentum.
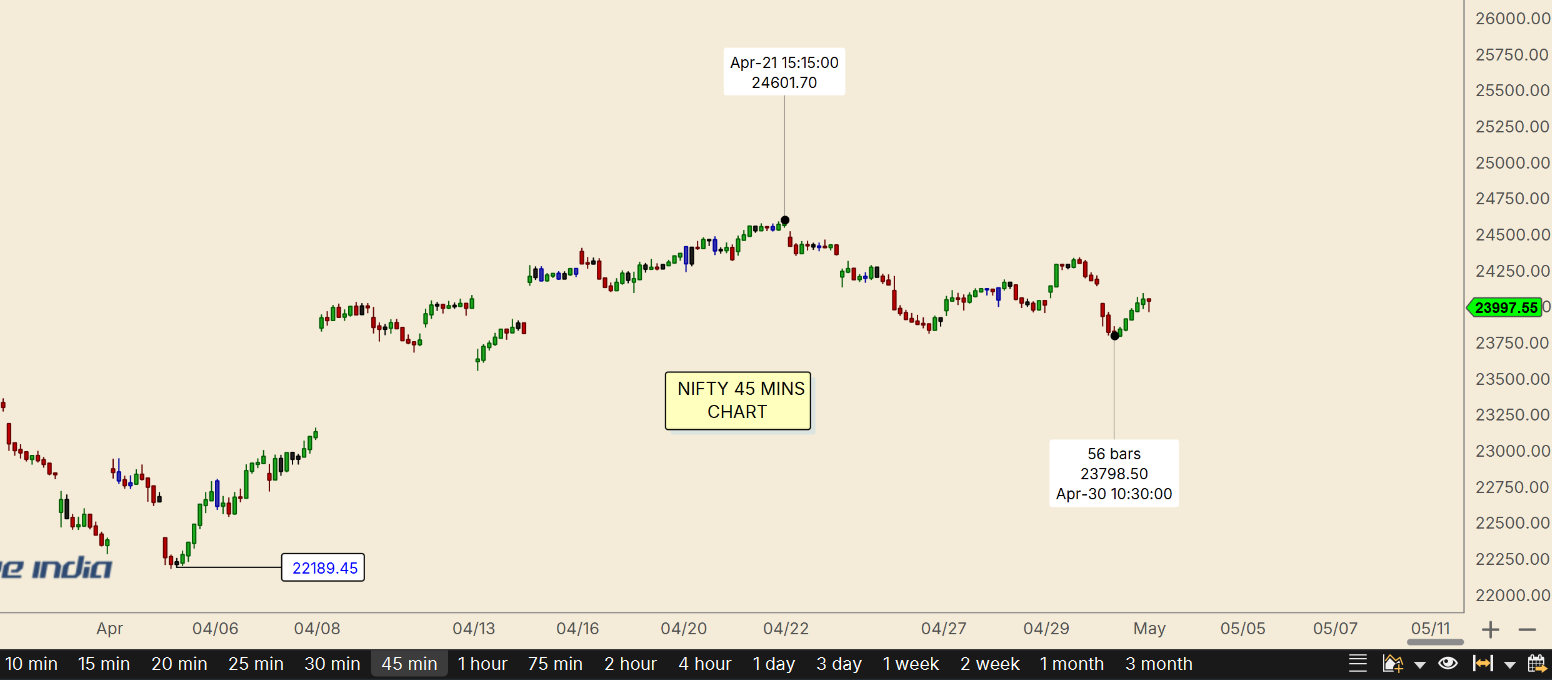
Outcome
In the sessions that followed, price transitioned from a sharp advance into a more corrective, overlapping phase — aligning with that view.
Why the view was taken
The rally from 22,182 retraced ~61% of a ~59-session decline in just ~10 sessions.
Such time-compressed moves typically do not sustain and tend to resolve through correction.
At the same time, the broader structure remained a triangle (wave D), indicating a counter-trend advance.
Current Structure
Price continues to behave in line with a wave B (of D) type correction —
overlapping, non-impulsive, and corrective in character (wave labelling not shown here).
Takeaway
Short-term price strength, when viewed in isolation, can be misleading.
Placed within a broader structural context, such moves tend to resolve in a more predictable manner.
Note
Subscriber updates include detailed wave labelling and full chart structure.
Charts shared here are simplified for clarity, while retaining the core view.
Ongoing updates track market structure across timeframes, with detailed wave labelling and time–price context.
Full access is available for subscribers who prefer a structured, process-driven approach.
Charting Platform
Charts shared here are built using MotiveWave, designed for structured analysis including Elliott Wave and time–price work.
If you’d like to explore the charting platform:
(Using this link may support the work shared here at no additional cost.)